Published: 2026-04-02T16:20:46.000Z
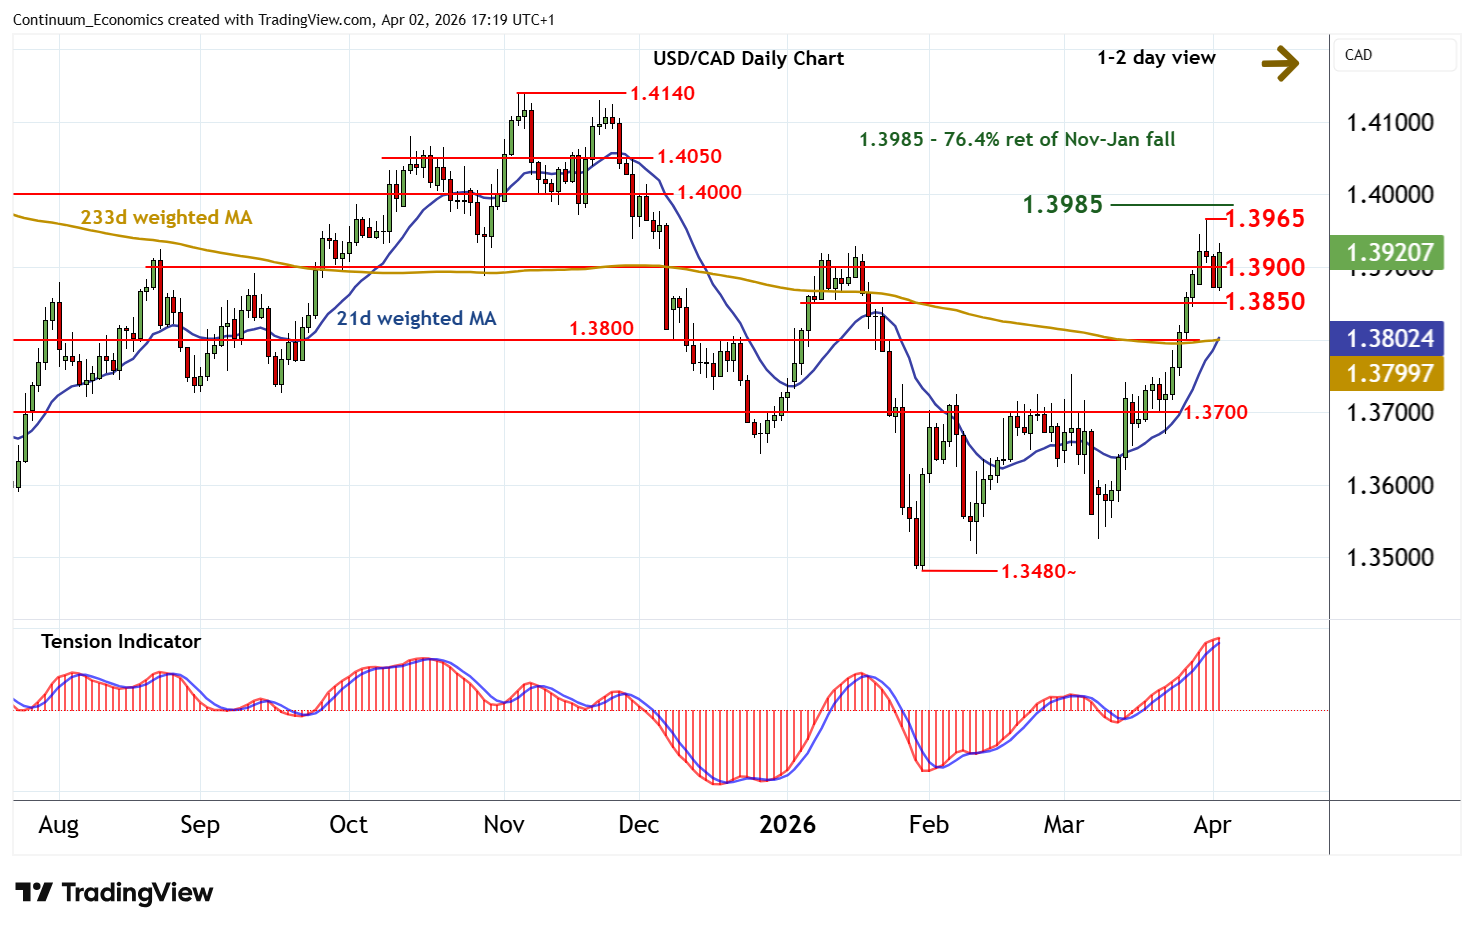
Chart USD/CAD Update: Back in consolidation
-
Anticipated tests lower have proven shallow
| Levels | Imp | Comment | Levels | Imp | Comment | |||
|---|---|---|---|---|---|---|---|---|
| R4 | 1.4050 | * | congestion | S1 | 1.3900 | * | congestion | |
| R3 | 1.4000 | ** | congestion | S2 | 1.3870 | * | congestion lows | |
| R2 | 1.3985 | ** | 76.4% ret of Nov-Jan fall | S3 | 1.3850 | * | congestion | |
| R1 | 1.3965 | * | 31 Mar YTD high | S4 | 1.3800 | * | congestion |
Asterisk denotes strength of level
17:00 BST - Anticipated tests lower have proven shallow, as oversold intraday studies unwind, with prices bouncing from support at the 1.3870 congestion lows into fresh consolidation above 1.3900. Daily readings continue to fall, however, suggesting any immediate gains could be limited in consolidation beneath the 1.3965 current year high of 31 March and the 1.3985 Fibonacci retracement, before rising weekly charts prompt a break. A close above here would turn sentiment positive and extend January gains beyond congestion resistance at 1.4000. Meanwhile, support is down to congestion around 1.3850, and should underpin any immediate tests lower.