Published: 2026-03-05T00:48:05.000Z
Chart NZD/USD Update: Range-bound in consolidation
1
Range-bound in consolidation following bounce from Tuesday's low at .5836, 50% Fibonacci level
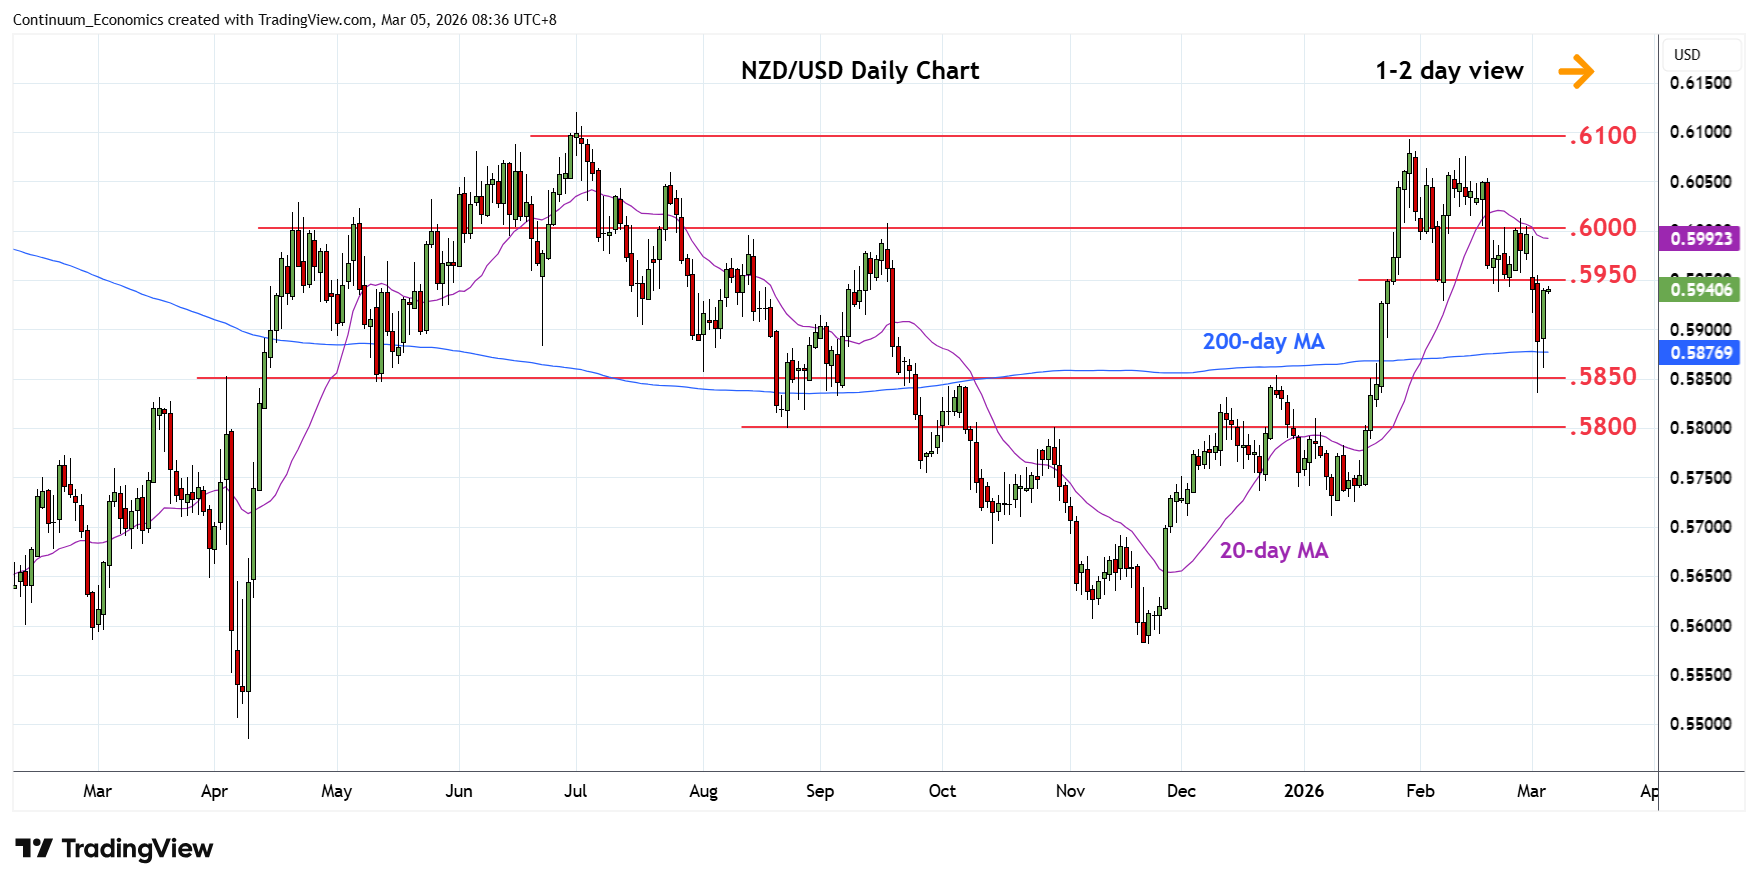
| Levels | Imp | Comment | Levels | Imp | Comment | |||
|---|---|---|---|---|---|---|---|---|
| R4 | .6075 | * | Feb high | S1 | .5850 | * | Dec high, congestion | |
| R3 | .6050 | * | congestion | S2 | .5836 | * | 3 Mar low, 50% | |
| R2 | .6000 | ** | figure, congestion | S3 | .5800 | ** | congestion | |
| R1 | .5950 | ** | congestion | S4 | .5775 | * | 61.8% Nov/Jan rally |
Asterisk denotes strength of level
00:40 GMT - Range-bound in consolidation following bounce from Tuesday's low at .5836, 50% Fibonacci level. Bounce see prices unwinding oversold intraday studies but this is expected to meet with fresh selling pressure later. Negative weekly studies suggest room for retest of the .5850/.5836 area. Below this, will see room for deeper corrective pullback to the strong support at the .5800 level and .5775, 61.8% Fibonacci level. Meanwhile, resistance at the .5950/.6000 congestion is expected to cap. Regaining this will return focus to the .6050/.6100 highs.