Published: 2026-04-29T00:33:23.000Z
Chart NZD/USD Update: Extend choppy trade within .5930/.5840 area
2
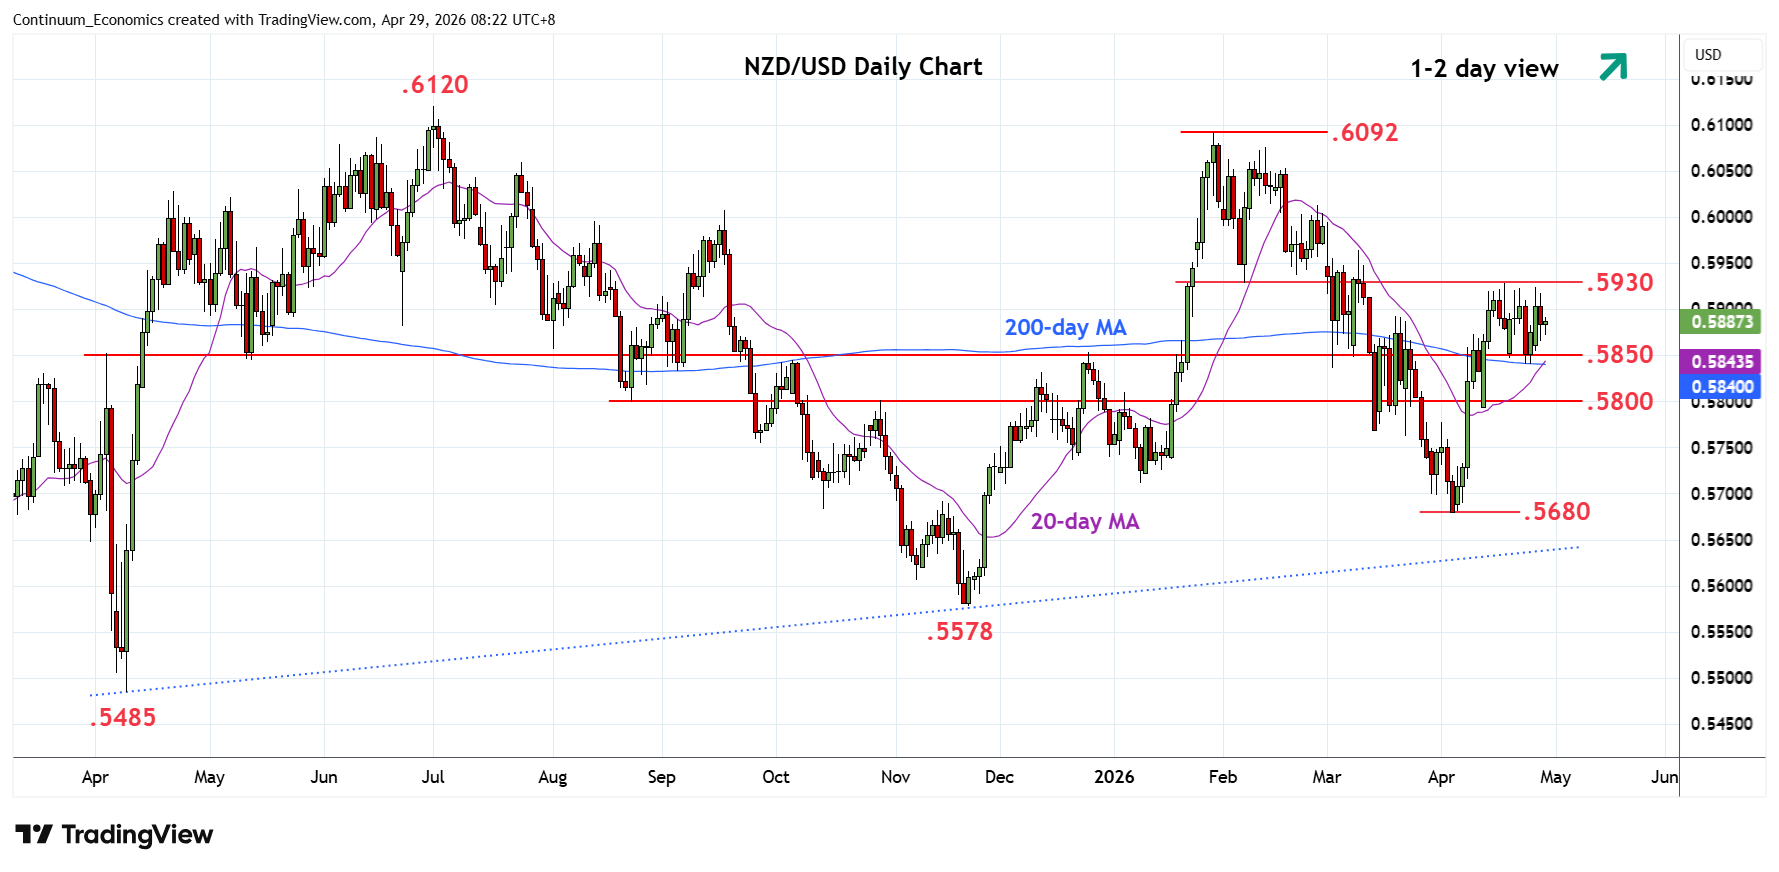
Little change, as prices extend choppy trade within the .5930/.5840 area
| Levels | Imp | Comment | Levels | Imp | Comment | |||
|---|---|---|---|---|---|---|---|---|
| R4 | .6050 | * | congestion | S1 | .5850/40 | ** | congestion, 200-day MA | |
| R3 | .6000/10 | * | congestion, 26 Feb high | S2 | .5800/95 | * | congestion, 13 Apr low | |
| R2 | .5950 | * | congestion | S3 | .5750 | * | congestion | |
| R1 | .5930 | ** | Feb low | S4 | .5680 | ** | 3 Apr YTD low |
Asterisk denotes strength of level
00:25 GMT - Little change, as prices extend choppy trade within the .5930/.5840 area to consolidate gains from the .5680, 3 April current year low. This is expected to give way to break later to further retrace the January/April losses. Clearance will see room for extension to resistance at the .5950 congestion and resistance at the .6000/10 figure and 26 February high. Beyond this will return focus to the .6050/92 congestion and 29 January YTD high. Meanwhile, support at the .5850/40 congestion and 200-day MA should underpin and sustain gains from the .5680 low.