Published: 2026-01-14T06:19:43.000Z
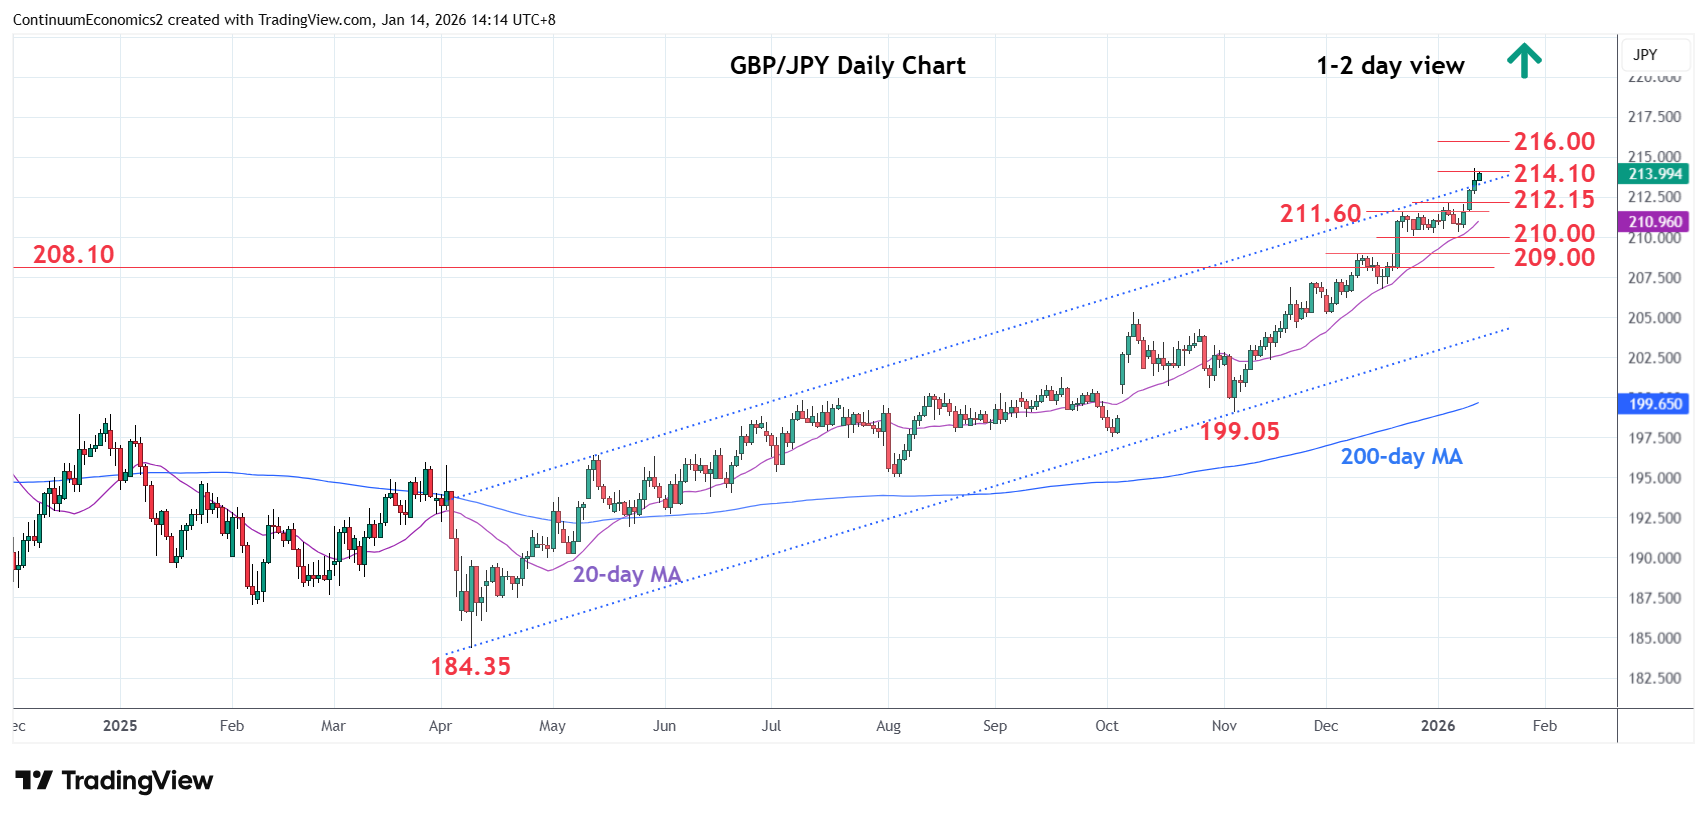
Chart GBP/JPY Update: Consolidating test of 214.00/10 resistance
-
Consolidating test of resistance at 214.00/10 August 2008 highs
| Levels | Imp | Comment | Levels | Imp | Comment | |||
|---|---|---|---|---|---|---|---|---|
| R4 | 219.40 | * | 76.4% 2007/2011 fall | S1 | 211.60 | ** | 22 Dec high | |
| R3 | 217.30 | * | 8 Jan 2008 high | S2 | 210.00 | * | congestion | |
| R2 | 216.00 | ** | Jul 2008 high | S3 | 209.00 | ** | 9 Dec high | |
| R1 | 214.00/10 | * | congestion, Aug 2008 high | S4 | 208.10 | ** | congestion, 2024 year high |
Asterisk denotes strength of level
06:15 GMT - Consolidating test of resistance at 214.00/10 August 2008 highs as prices unwind overbought intraday studies. Break here will see room for extension to the 216.00, July 2008 high. However, the overbought daily and weekly studies caution corrective pullback. Meanwhile, support is raised to the 212.00/211.60 congestion area and late-December high which should underpin. Would take break here to open up room for deeper correction of the April gains and see deeper pullback to support at the 209.00/208.10, 9 December high and 2024 year high.