Chart USD/RUB Update: Cautious trade

Quiet trade, with prices balanced in a tight range above 77.8500
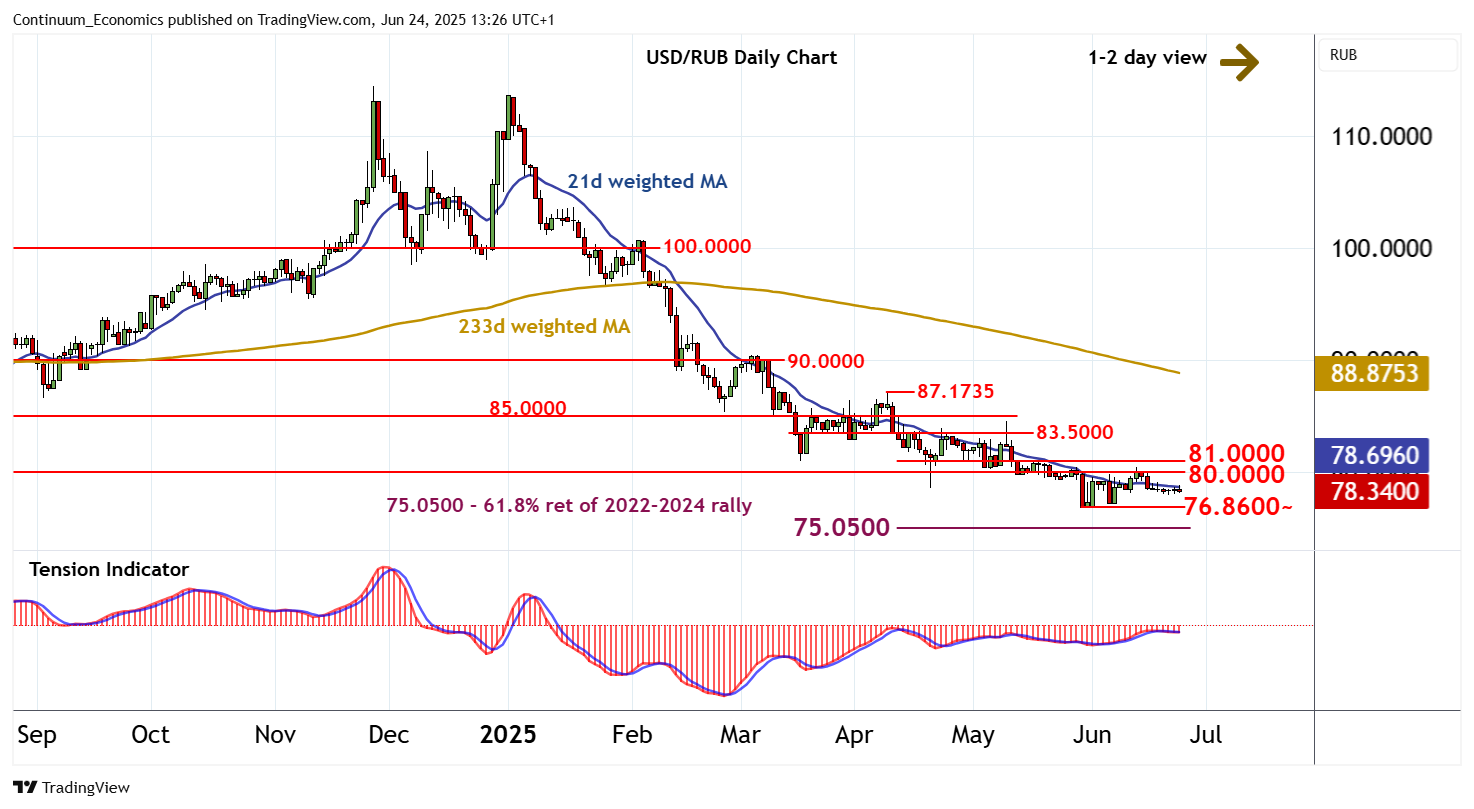
| Levels | Comment | Levels | Comment | |||||
| R4 | 85.0000 | ** | congestion | S1 | 77.8500 | congestion lows | ||
| R3 | 83.5000 | * | congestion | S2 | 76.8600~ | ** | 29 May YTD low | |
| R2 | 81.0000 | * | break level | S3 | 75.0500 | ** | 61.8% ret of 2022-2024 rally | |
| R1 | 80.0000 | ** | congestion | S4 | 74.8450 | ** | May 2023 low |
Asterisk denotes strength of level
13:05 BST - Quiet trade, with prices balanced in a tight range above 77.8500. Daily readings are flat, highlighting potential for further sideways trade. But rising weekly charts suggest potential for a move towards congestion resistance at 80.0000 - 81.0000, where bearish longer-term charts are expected to prompt renewed selling interest. A close above here, if seen, will turn sentiment positive and prompt further gains towards 83.5000. Meanwhile, critical support is at the 76.8600~ current year low of 29 May. A close beneath here would turn sentiment negative and extend November 2024 losses towards strong support at the 74.8450 low of May 2023 and the 75.0500 Fibonacci retracement.