Continuum Economics
  • Search
  • About Us
  • Buy
  • Invite A Friend
  • My Basket
  • Articles
  • Calendar
  • Forecasts
  • Events
  • Data
  • Newsletters
  • My Alerts
  • Community
  • Directory
  • About Us
  • Buy
  • Invite A Friend
  • My Basket
  • Articles
    • All
    • Thematic
    • Tactical
    • Asia
    • EMEA
    • Americas
    • Newsletters
    • Freemium
    • Editor's Choice
    • Most Viewed
    • Most Shared
    • Most Liked
  • Calendar
    • Interactive
      • China
      • United States
      • Eurozone
      • United Kingdom
    • Month Ahead
    • Reviews
    • Previews
  • Forecasts
    • Forecasts
    • Key Views
  • Events
    • Media
    • Conference Calls
  • Data
    • Country Insights
    • Shadow Credit Ratings
    • Full CI Data Download
  • Newsletters
  • My Alerts
  • Community
    • FX
    • Fixed Income
    • Macro Strategy
    • Credit Markets
    • Equities
    • Commodities
    • Precious Metals
    • Renewables
  • Directory
  • My Account
  • Notifications Setup
  • Account Details
  • Recent Devices
  • Distribution Lists
  • Shared Free Trials
  • Saved Articles
  • Shared Alerts
  • My Posts
Published: 2025-03-14T12:35:45.000Z

Chartbook: UK Chart FTSE 100 Update: Fresh highs not sustained - potential for a fall back into range trade

byMike Macdonald

Senior Technical Strategist
1

The anticipated break above the 8474 monthly high of May 2024 has posted a fresh all-time high just above 8900

The anticipated break above the 8474 monthly high of May 2024 has posted a fresh all-time high just above 8900.
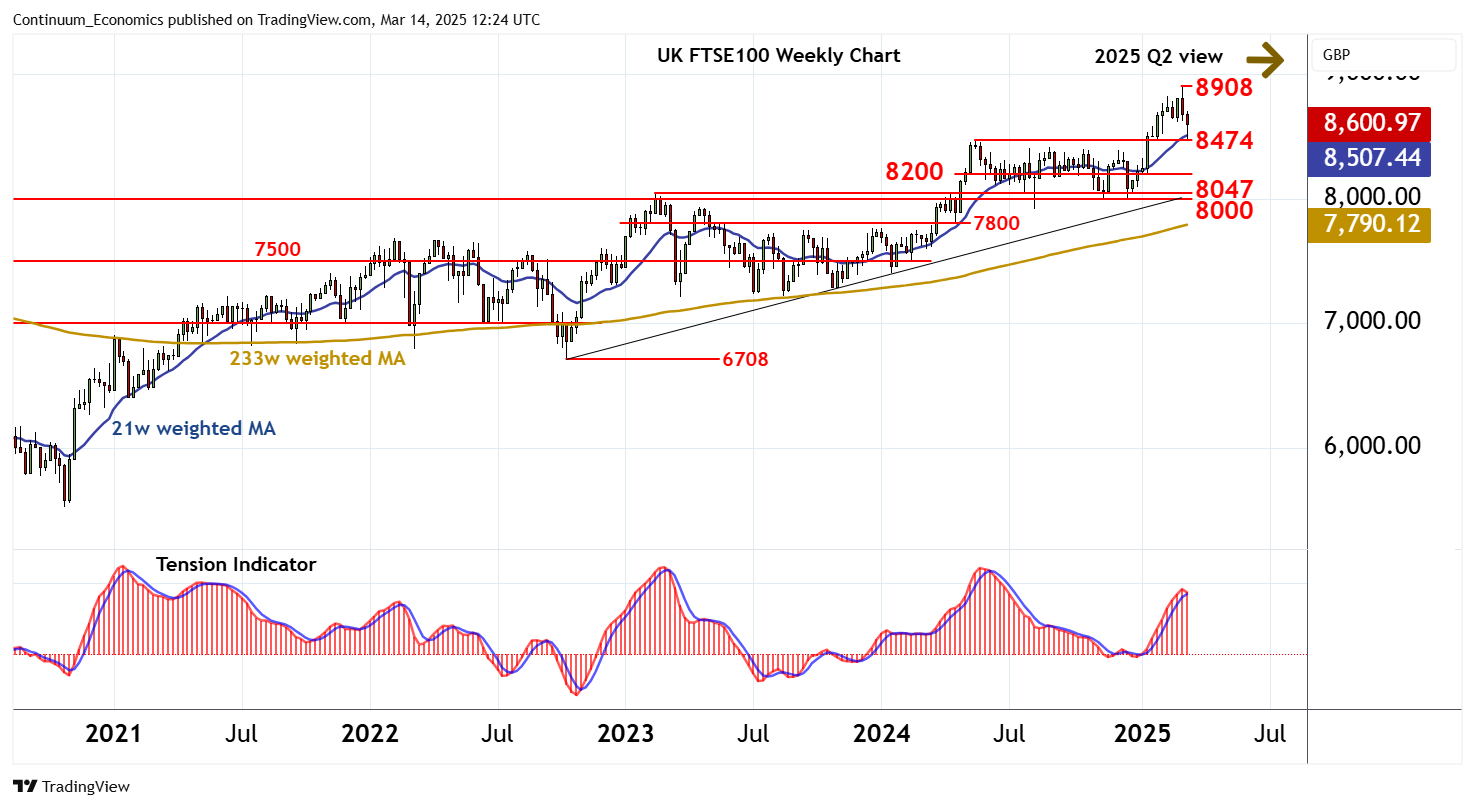
However, steady selling interest has appeared here, as overbought weekly stochastics unwind and the positive weekly Tension Indicator turns down, with prices reaching 8474 before bouncing to 8600.
In the coming weeks, further losses are looked for as weekly sentiment deteriorates, with a later break below 8474 putting prices into the broad congestion range above 8200. A test beneath here cannot be ruled out. But rising monthly charts are expected to limit scope in renewed buying interest/consolidation above critical support at congestion around 8000 and the 8047 year high of February 2023.
A further close beneath here would confirm a significant top in place at 8900, and lead to a deeper correction of the rally from the 6708 year low of October 2022.
 
Meanwhile, resistance is up to the 8908 current all-time high of 3 March.
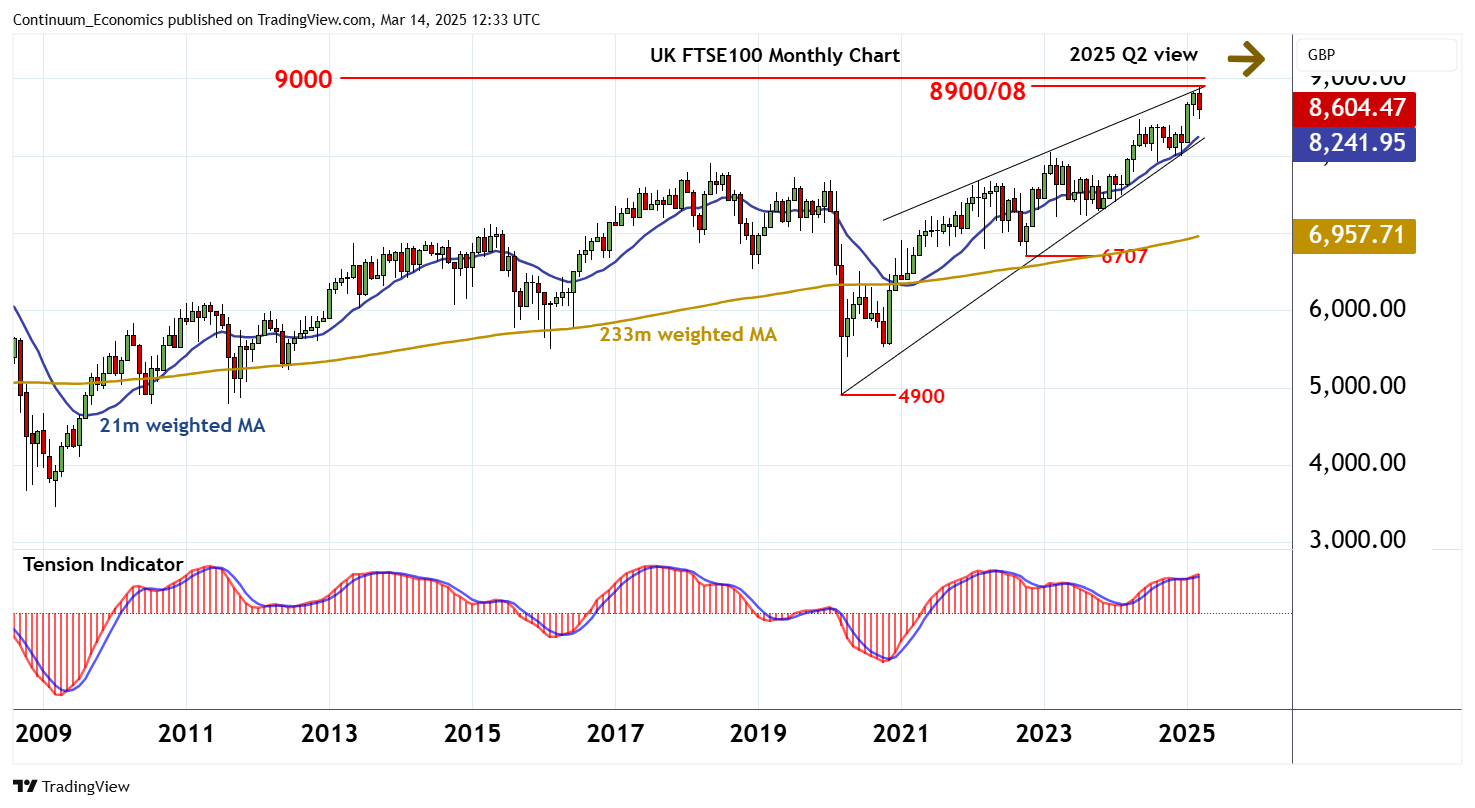
Overbought monthly stochastics are expected to limit any immediate bounce in consolidation beneath here.
However, the rising monthly Tension Indicator and improving longer-term charts point to room for a later break and fresh all-time highs towards psychological resistance at 9000.
Continue to read the article for free
Login

or

or

Topics
GB FTSE 100-TA
Technical Analysis
ChartBook

GENERAL

  • Home
  • About Us
  • Our Team
  • Careers

LEGAL

  • Terms and Conditions
  • Privacy Policy
  • Compliance
  • GDPR

GET IN TOUCH

  • Contact Us
Continuum Economics
The Technical Analyst Awards Winner 2021
The Technical Analyst Awards Finalist 2020
image