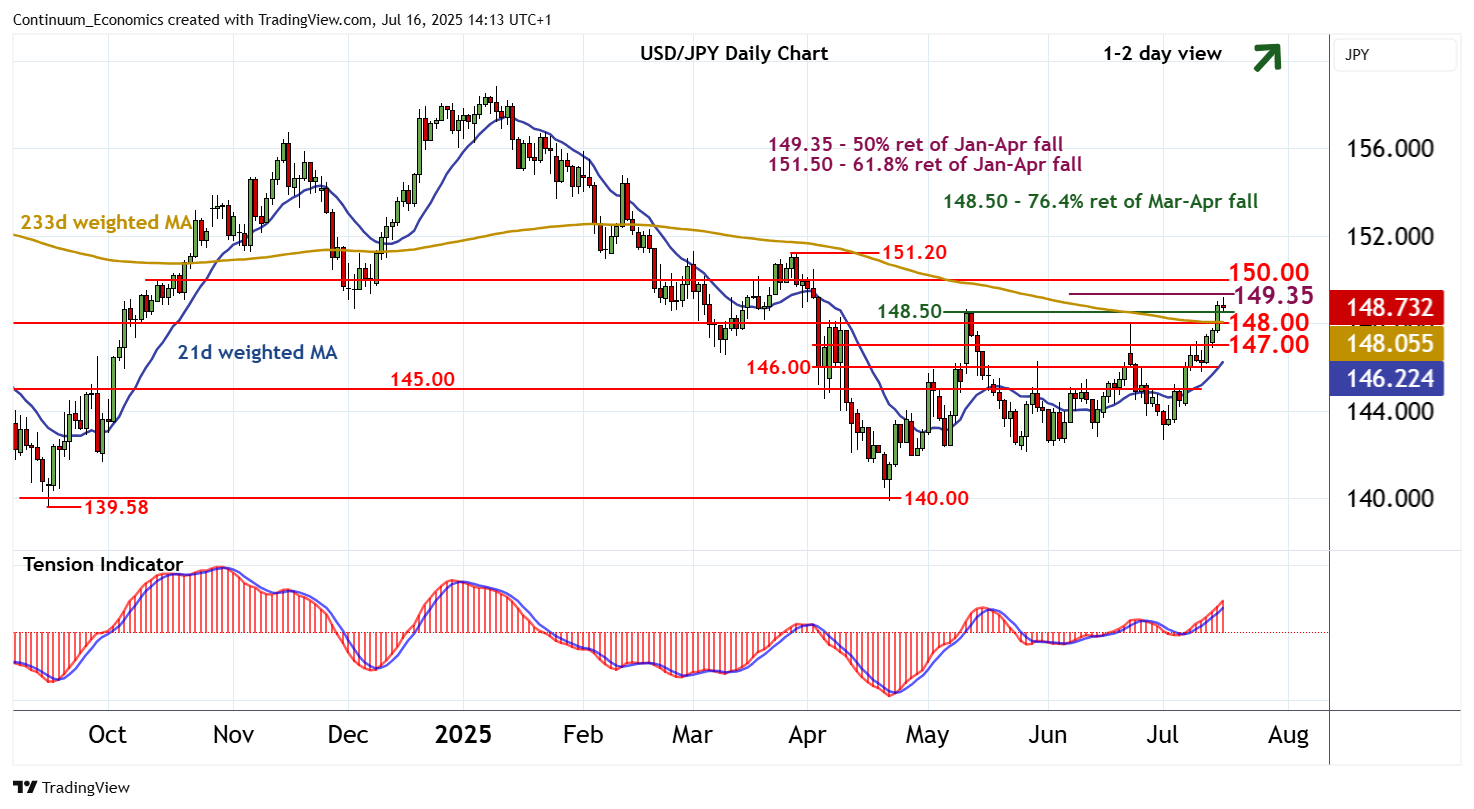
Chart USD/JPY Update: Resistance at the 149.35 Fibonacci retracement

The anticipated break above the 148.50 Fibonacci retracement has met selling interest just below the 149.35 longer-term Fibonacci retracement
| Levels | Imp | Comment | Levels | Imp | Comment | |||
|---|---|---|---|---|---|---|---|---|
| R4 | 151.20 | ** | 27 Mar (m) high | S1 | 148.00 | ** | break level | |
| R3 | 150.49 | 2 Apr (m) high | S2 | 147.00 | congestion | |||
| R2 | 150.00 | ** | congestion | S3 | 146.00 | * | break level | |
| R1 | 149.35 | ** | 50% ret of Jan-Apr fall | S4 | 145.00 | * | congestion |
Asterisk denotes strength of level
13:55 BST - The anticipated break above the 148.50 Fibonacci retracement has met selling interest just below the 149.35 longer-term Fibonacci retracement, as overbought intraday studies unwind and overbought daily stochastics flatten, with prices currently trading around 148.70. The daily Tension Indicator continues to rise and broader weekly charts are also positive, highlighting room for further strength in the coming sessions. A later break above 149.35 will further improve sentiment and extend April gains initially towards congestion around 150.00. Meanwhile, support is raised to 148.00. A close beneath here would turn sentiment neutral and give way to consolidation above congestion support at 147.00.