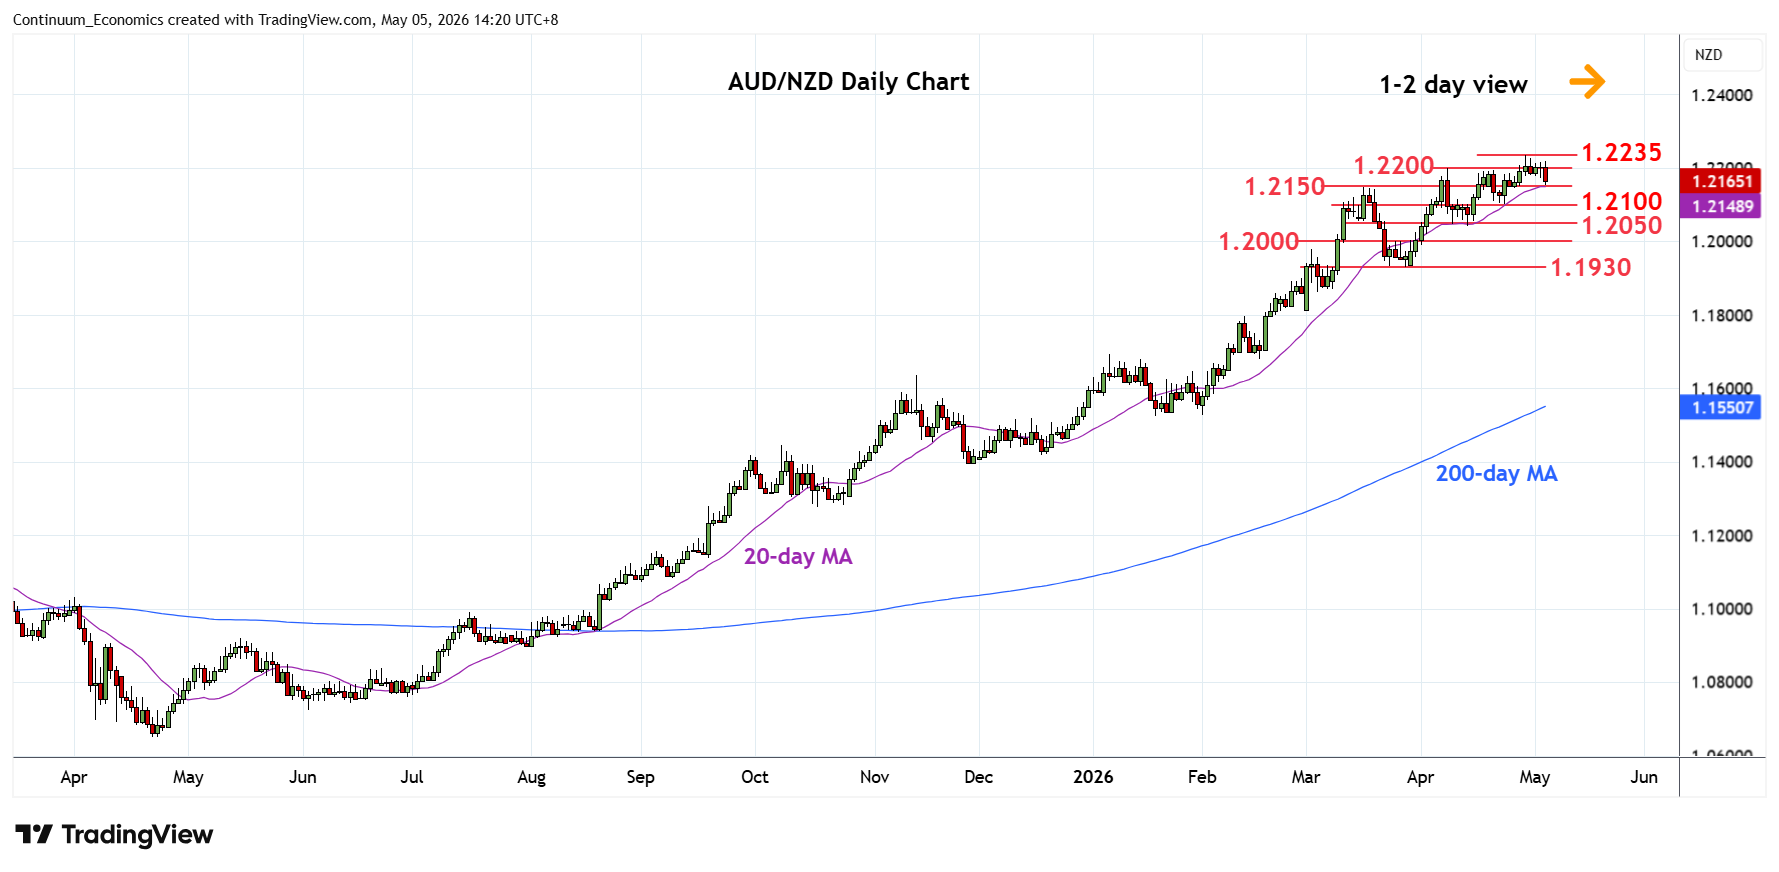
Chart AUD/NZD Update: Consolidating below 1.2235 current year high
Leaning lower from the 1.2235 high of last week as prices consolidate recent gains from the 1.1930, 27 March low
| Level | Comment | Level | Comment | |||||
|---|---|---|---|---|---|---|---|---|
| R4 | 1.2350 | * | 61.8% 2011/2020 fall | S1 | 1.2150 | * | Mar high | |
| R3 | 1.2300/10 | ** | congestion, 2011 yr low | S2 | 1.2100 | ** | 23 Apr low | |
| R2 | 1.2235 | ** | 29 Apr YTD high | S3 | 1.2050 | ** | congestion | |
| R1 | 1.2200 | * | 8 Apr high, congestion | S4 | 1.2000 | * | congestion |
Asterisk denotes strength of level
06:30 GMT - Leaning lower from the 1.2235 high of last week as prices consolidate recent gains from the 1.1930, 27 March low. Pullback see support starting at 1.2150 March high. Would take break here to ease the upside pressure and open up room for deeper pullback to support at the 1.2100/1.2050 congestion area. Overbought daily and weekly studies caution corrective pullback and below the latter will see scope to the 1.2050 congestion and 1.2000 figure. Meanwhile, resistance remains at the 1.2200/35 April highs. Clearance here, if seen, will see room for extension to 1.2300 congestion and 1.2350, 61.8% Fibonacci retracement.