Published: 2025-09-19T07:30:56.000Z
Chart GBP/USD Update: Under pressure
1
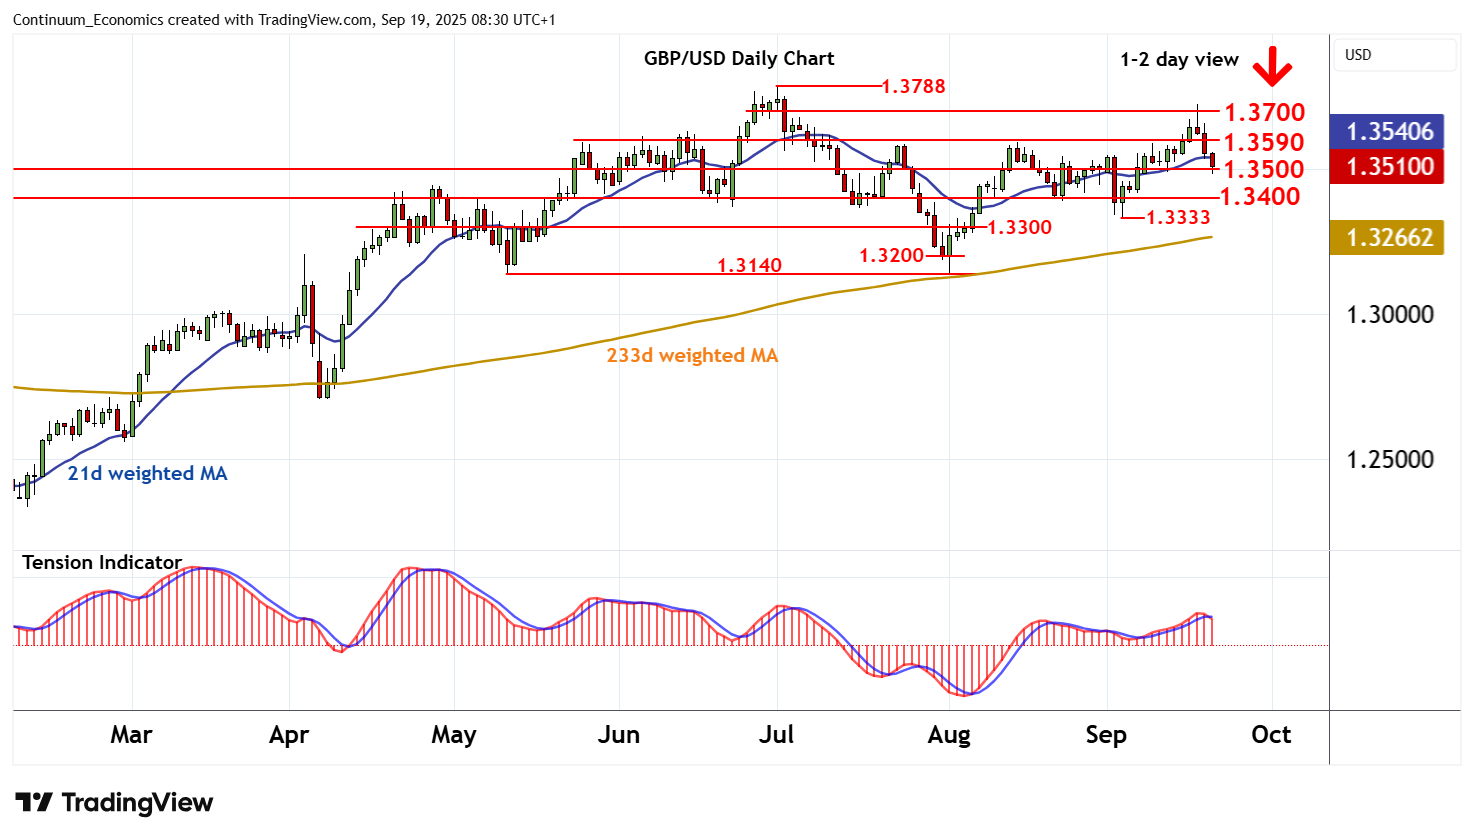
Anticipated losses have reached congestion support at 1.3500
| Level | Comment | Level | Comment | |||||
|---|---|---|---|---|---|---|---|---|
| R4 | 1.3788 | ** | 1 Jul YTD high | S1 | 1.3500 | ** | congestion | |
| R3 | 1.3725 | 17 Sep high | S2 | 1.3400 | * | congestion | ||
| R2 | 1.3700 | minor congestion | S3 | 1.3333 | * | 3 Sep low | ||
| R1 | 1.3600 | * | break level | S4 | 1.3300 | * | congestion |
Asterisk denotes strength of level
08:10 BST - Anticipated losses have reached congestion support at 1.3500, where flat oversold intraday studies are prompting short-term reactions. Daily stochastics and the daily Tension Indicator continue to track lower, highlighting room for further losses in the coming sessions. A break beneath here will open up further congestion around 1.3400. But mixed weekly charts are expected to limit any initial tests in consolidation. Meanwhile, resistance is lowered to 1.3600. A close above here would help to stabilise price action and prompt consolidation beneath congestion around 1.3700.