Published: 2025-11-05T01:02:47.000Z
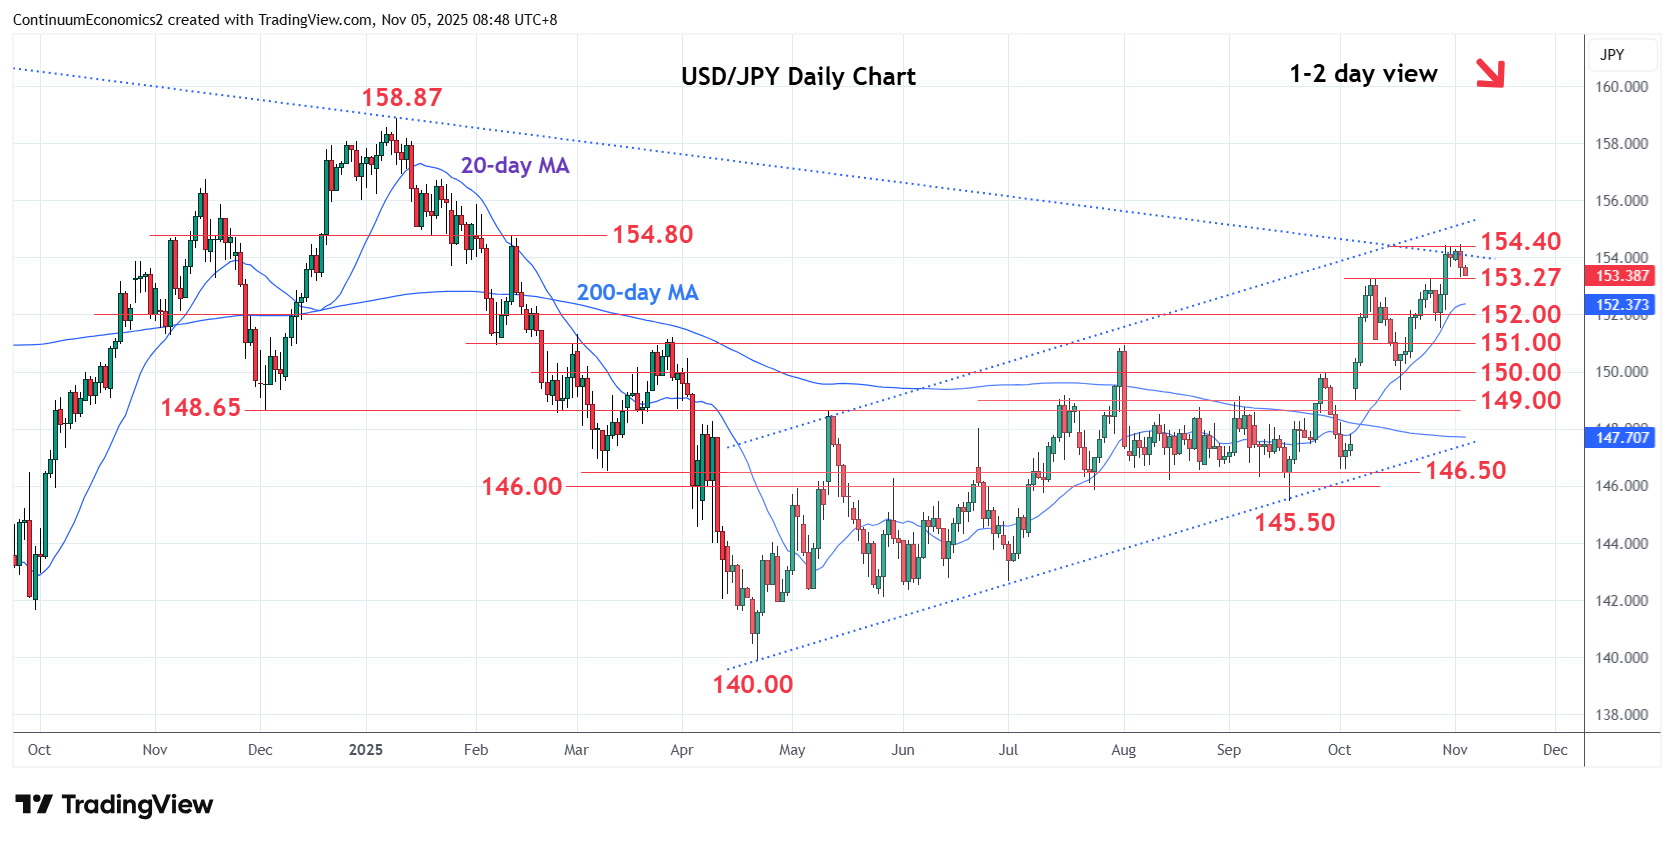
Chart USD/JPY Update: Under pressure from 154.40/48 highs
2
Failure to clear the 154.40, 76.4% Fibonacci level and trendline from July 2024 year high, has given way to pullback towards support at 153.27
| Levels | Imp | Comment | Levels | Imp | Comment | |||
|---|---|---|---|---|---|---|---|---|
| R4 | 156.00 | * | congestion | S1 | 153.27/00 | ** | 10 Oct high, congestion | |
| R3 | 155.00 | * | congestion | S2 | 152.00 | * | congestion | |
| R2 | 154.80 | * | 12 Feb high | S3 | 151.50 | * | congestion | |
| R1 | 154.40/48 | ** | 76.4%, 4 Nov high | S4 | 150.92 | ** | Aug high |
Asterisk denotes strength of level
00:50 GMT - Failure to clear the 154.40, 76.4% Fibonacci level and trendline from July 2024 year high, has given way to pullback towards support at 153.27, 10 Octobeer high. Intraday and daily studies are unwinding overbought reading and see risk for break here and the 153.00 level to open up room for deeper pullback to retrace strong gains from the 145.50, September low. Lower will open up room to 152.00/151.50 congestion area and strong support at 150.92, August high. Meanwhile, resistance at 154.40/48, Fibonacci level and 4 November high, now expected to cap.