Published: 2025-09-16T02:19:51.000Z
Chart USD/SGD Update: Pressuring 1.2800/1.2790 support
0
-
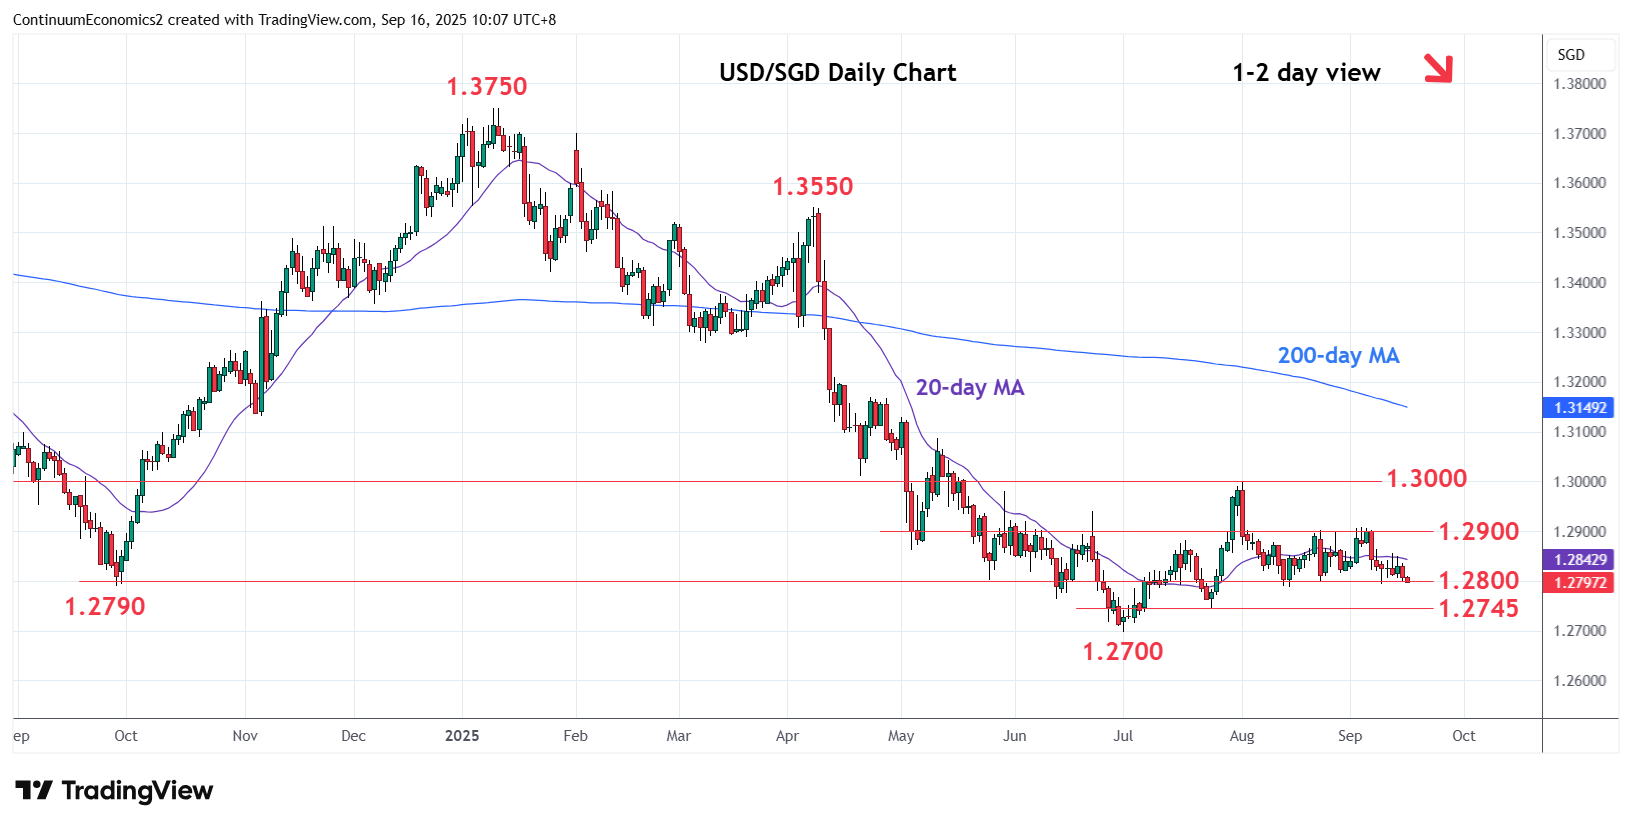
Under pressure as consolidation gives way to selling pressure to weigh on support at the 1.2800/1.2790
| Level | Comment | Level | Comment | ||||
|---|---|---|---|---|---|---|---|
| R4 | 1.3000/10 | ** | Aug high, 21 Apr low | S1 | 1.2800/90 | * | congestion, 2024 year lows |
| R3 | 1.2940 | * | Jun high | S2 | 1.2745 | * | 24 Jul low |
| R2 | 1.2900 | ** | congestion | S3 | 1.2700 | ** | 1 Jul YTD low |
| R1 | 1.2850 | * | congestion | S4 | 1.2650 | * | congestion |
Asterisk denotes strength of level
02:15 GMT - Under pressure as consolidation gives way to selling pressure to weigh on support at the 1.2800/1.2790, congestion and 2024 year low. Break here will extend losses from the 1.3000, August swing high. Lower will see room to the 1.2745 support but potential would be seen for retest of 1.2700, July current year low. Break here will extend the broader losses from the March 2020 high. Meanwhile, resistance at the 1.2850/60 congestion area is expected to cap and sustain pullback from the 1.2900 range high.