Published: 2025-12-08T00:20:52.000Z
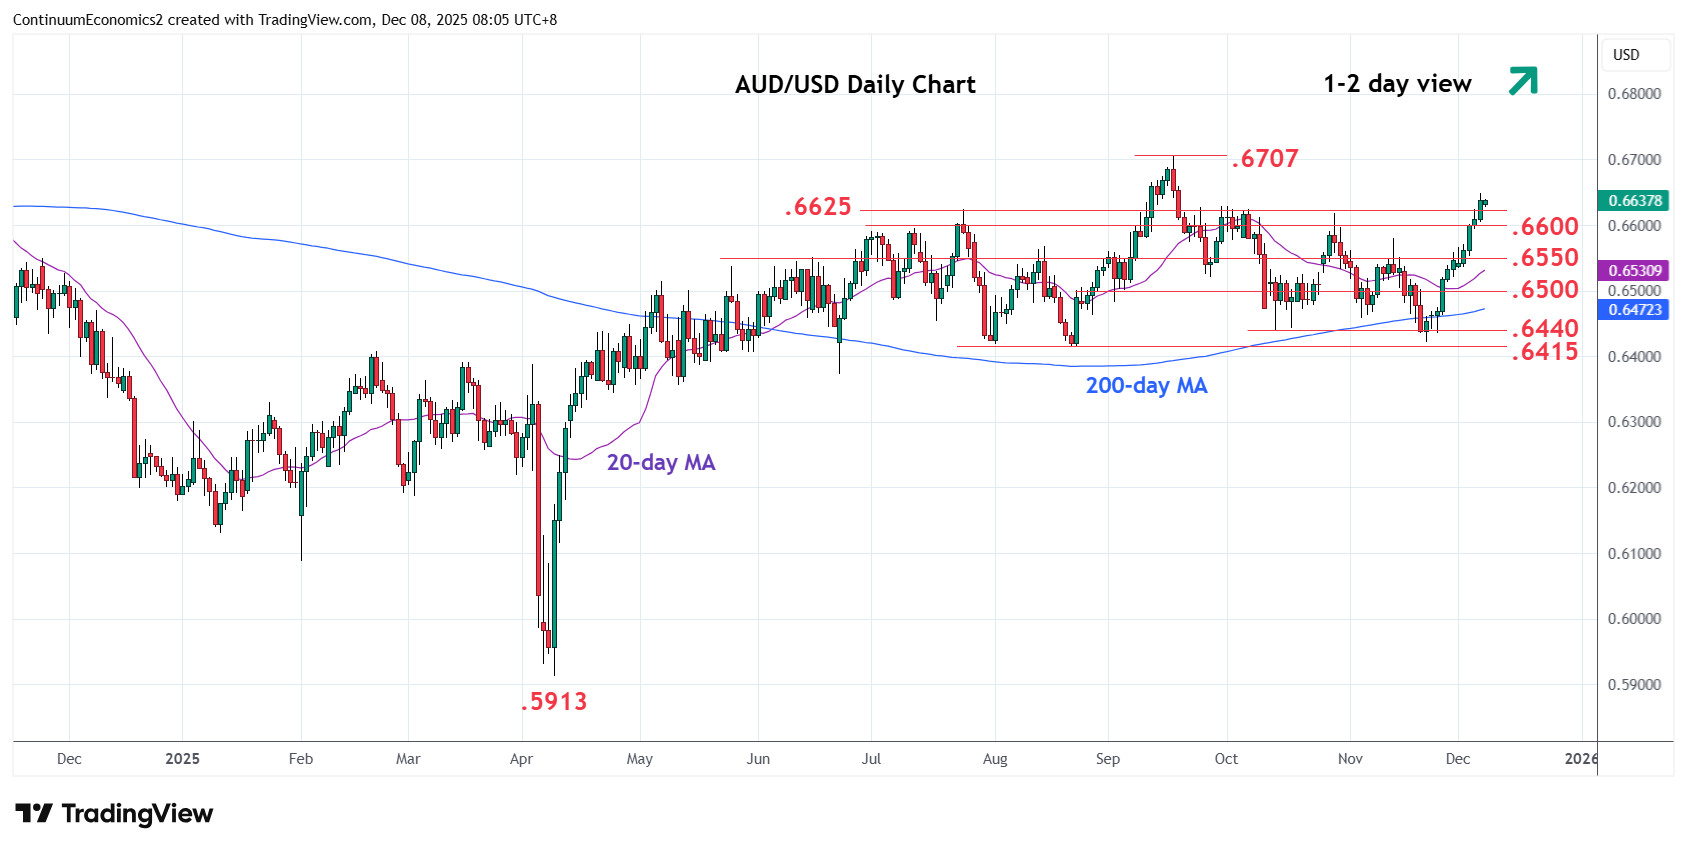
Chart AUD/USD Update: Within reach of .6700/07 high
1
Break above resistance at the .6600/25 area has seen gains to the .6650 congestion
| Levels | Imp | Comment | Levels | Imp | Comment | |||
|---|---|---|---|---|---|---|---|---|
| R4 | 0.6800 | * | congestion | S1 | 0.6625/00 | * | Jul high, congestion | |
| R3 | 0.6750 | * | congestion | S2 | 0.6550 | * | congestion | |
| R2 | 0.6700/07 | ** | figure, 17 Sep YTD high | S3 | 0.6500 | * | congestion | |
| R1 | 0.6650 | * | congestion | S4 | 0.6440/15 | ** | Oct, Aug lows |
Asterisk denotes strength of level
00:10 GMT - Break above resistance at the .6600/25 area has seen gains to the .6650 congestion. Pause here see prices consolidating strong gains from the .6421 low but pressure remains on the upside. Higher will see scope for extension to retest the .6707 September YTD high where reaction can be expected as daily studies extend into overbought areas. Clearance here will extend the broader gains from the April low to retrace losses from the September 2024 high. Meanwhile, support is raised to the .6625/00 high of July and congestion which should now underpin and sustain gains from the November low.