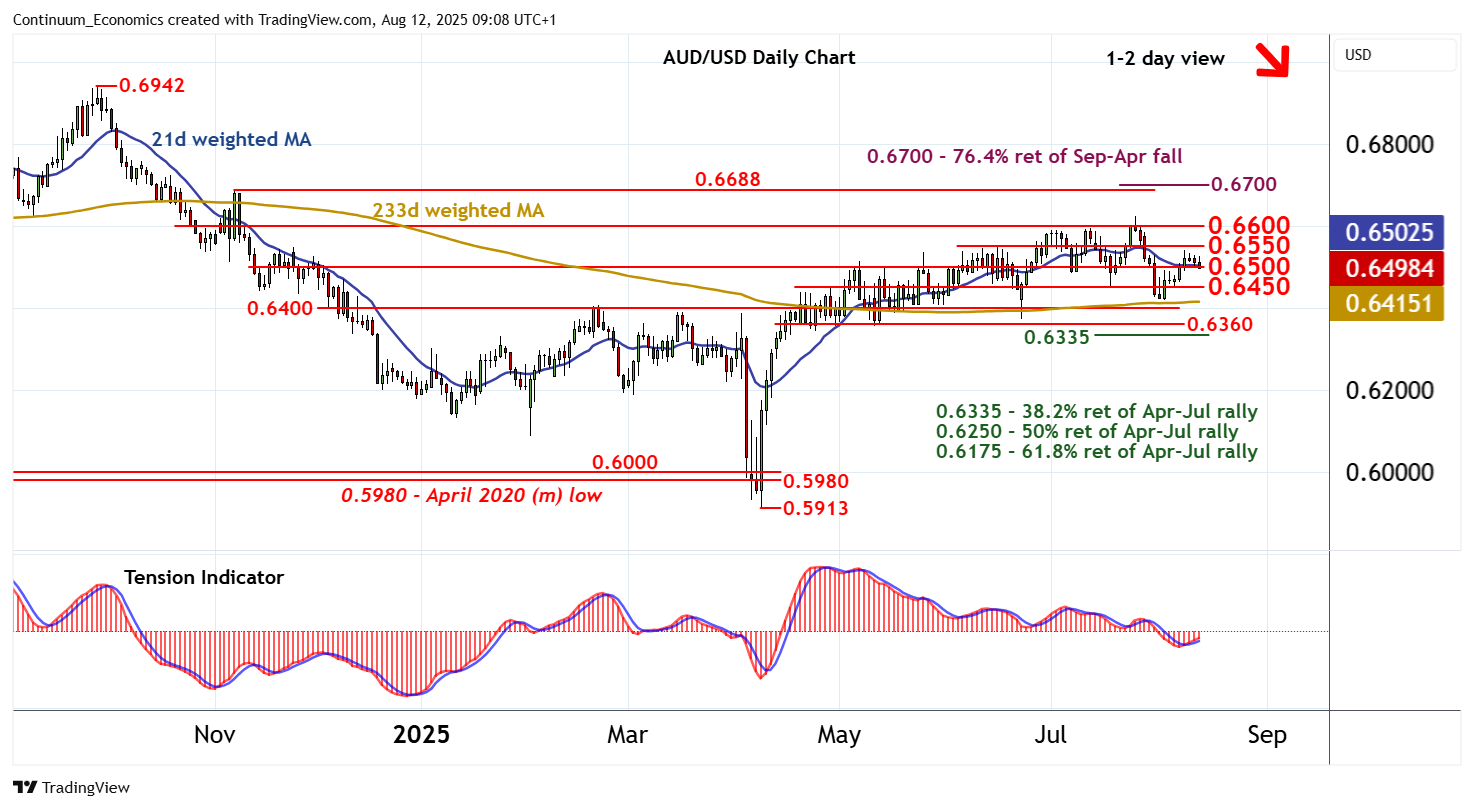
Chart AUD/USD Update: Leaning lower

Little change, as prices extend consolidation above congestion support at 0.6500
| Levels | Imp | Comment | Levels | Imp | Comment | |||
|---|---|---|---|---|---|---|---|---|
| R4 | 0.6688 | * | 7 Nov (m) high | S1 | 0.6500 | * | congestion | |
| R3 | 0.6625 | 24 Jul YTD high | S2 | 0.6450 | congestion | |||
| R2 | 0.6600 | ** | congestion | S3 | 0.6400 | * | break level | |
| R1 | 0.6550 | * | congestion | S4 | 0.6360 | ** | break level |
Asterisk denotes strength of level
08:55 BST - Little change, as prices extend consolidation above congestion support at 0.6500. Intraday studies have turned down and rising daily stochastics are flattening, suggesting room for a test beneath here. Focus will then turn to congestion around 0.6450. But the rising daily Tension Indicator is expected to limit any initial tests in consolidation, before negative weekly charts extend losses still further. A later break beneath here will open up 0.6400. However, a close below 0.6360 is needed to turn sentiment negative and confirm a near-term top in place around 0.6600, as July losses then extend initially towards the 0.6335 Fibonacci retracement. Meanwhile, resistance remains at congestion around 0.6550 and extends to further congestion around 0.6600. This range should cap any immediate tests higher.