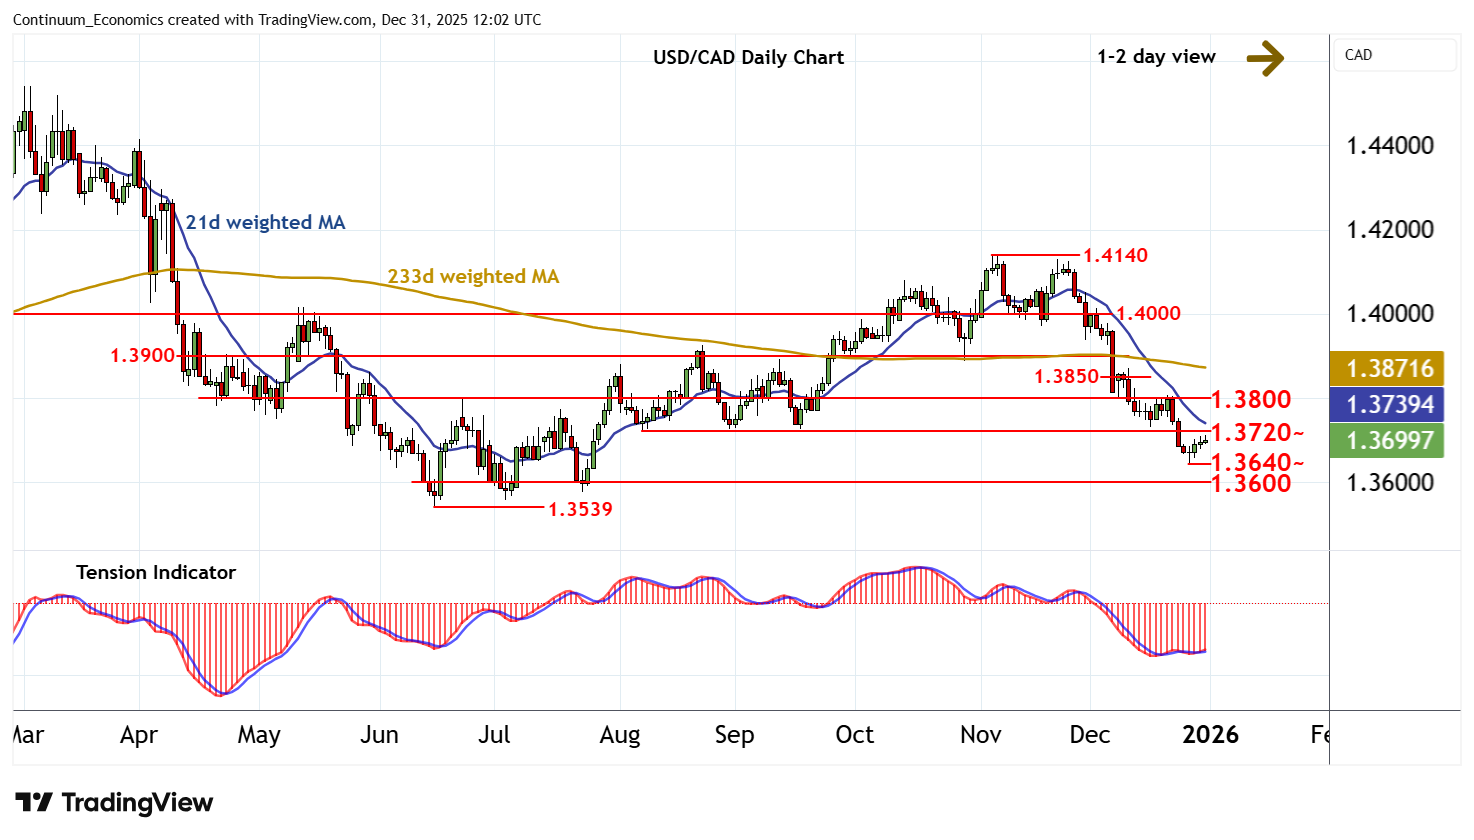
Chart USD/CAD Update: Focus on resistance at 1.3720~
Little change, as prices extend cautious trade around 1.3700
| Levels | Imp | Comment | Levels | Imp | Comment | |||
|---|---|---|---|---|---|---|---|---|
| R4 | 1.3900 | ** | break level | S1 | 1.3640 | * | 26 Dec (w) low | |
| R3 | 1.3850 | congestion | S2 | 1.3600 | * | congestion | ||
| R2 | 1.3800 | ** | congestion | S3 | 1.3539 | ** | 16 Jun YTD low | |
| R1 | 1.3720~ | ** | Aug-Sep lows | S4 | 1.3500 | ** | congestion |
Asterisk denotes strength of level
11:55 GMT - Little change, as prices extend cautious trade around 1.3700. Daily stochastics are rising and the bearish daily Tension Indicator is also ticking higher, suggesting potential for a break above here towards resistance at the 1.3720~ lows from August-September. However, mixed/negative weekly readings are expected to limit any tests in consolidation. A close above here, if seen, would help to further stabilise price action and prompt consolidation beneath congestion around 1.3800. Meanwhile, support remains at the 1.3640 weekly low of 26 December. A close beneath here would turn sentiment negative and extend November losses initially towards congestion around 1.3600.