Continuum Economics
  • Search
  • About Us
  • Buy
  • Invite A Friend
  • My Basket
  • Articles
  • Calendar
  • Forecasts
  • Events
  • Data
  • Newsletters
  • My Alerts
  • Community
  • Directory
  • About Us
  • Buy
  • Invite A Friend
  • My Basket
  • Articles
    • All
    • Thematic
    • Tactical
    • Asia
    • EMEA
    • Americas
    • Newsletters
    • Freemium
    • Editor's Choice
    • Most Viewed
    • Most Shared
    • Most Liked
  • Calendar
    • Interactive
      • China
      • United States
      • Eurozone
      • United Kingdom
    • Month Ahead
    • Reviews
    • Previews
  • Forecasts
    • Forecasts
    • Key Views
  • Events
    • Media
    • Conference Calls
  • Data
    • Country Insights
    • Shadow Credit Ratings
    • Full CI Data Download
  • Newsletters
  • My Alerts
  • Community
    • FX
    • Fixed Income
    • Macro Strategy
    • Credit Markets
    • Equities
    • Commodities
    • Precious Metals
    • Renewables
  • Directory
  • My Account
  • Notifications Setup
  • Administration Panel
  • Account Details
  • Recent Devices
  • Distribution Lists
  • Shared Free Trials
  • Saved Articles
  • Shared Alerts
  • My Posts
Published: 2025-12-12T08:26:32.000Z

Chartbook: Chart AUD/USD: Room to extend gains from April YTD low

1

Pullback from the .6700 high in Q3 has given way to rebound at the .6415/00 support to return focus to the .6700 high and .6710, 38.2% Fibonacci retracement level.

Pullback from the .6700 high in Q3 has given way to rebound at the .6415/00 support to regain the .6600 level. Break here return focus to the .6700 high and .6710, 38.2% Fibonacci retracement level.

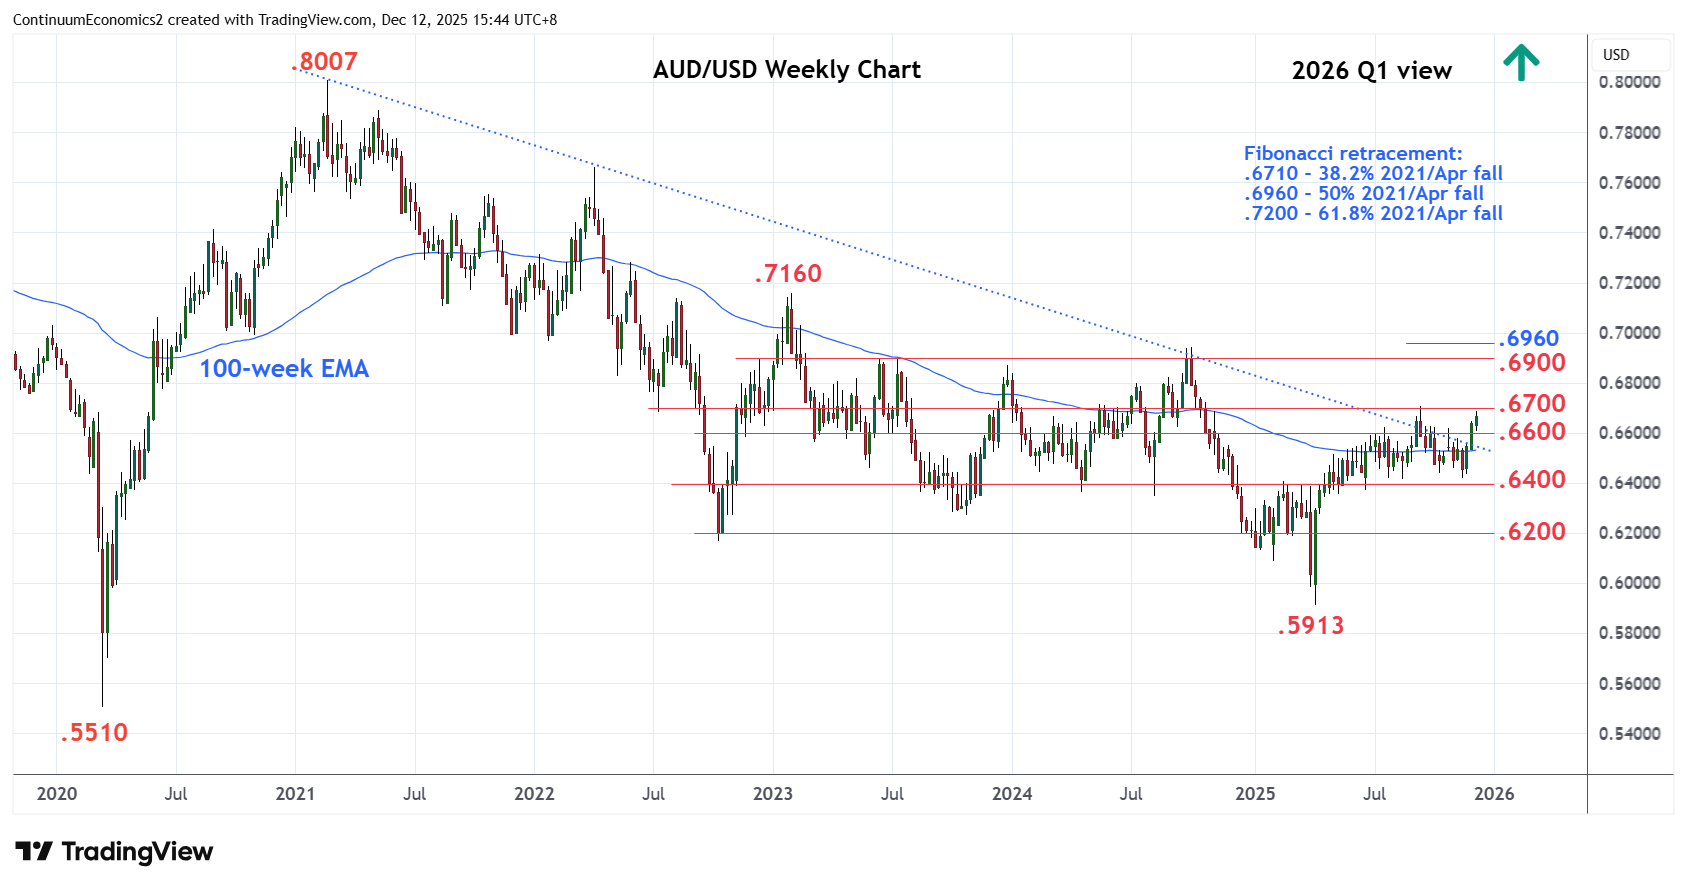
Clearance here will further extend gains from the April low to retrace losses from the 2021 year high to resistance at the .6800 congestion. Break here will open up room for extension to the strong resistance at .6960/.7000, the 50% Fibonacci level and congestion area. Gains beyond this will turn focus to the 2023 year high at .7160 then the .7200, 61.8% Fibonacci level.

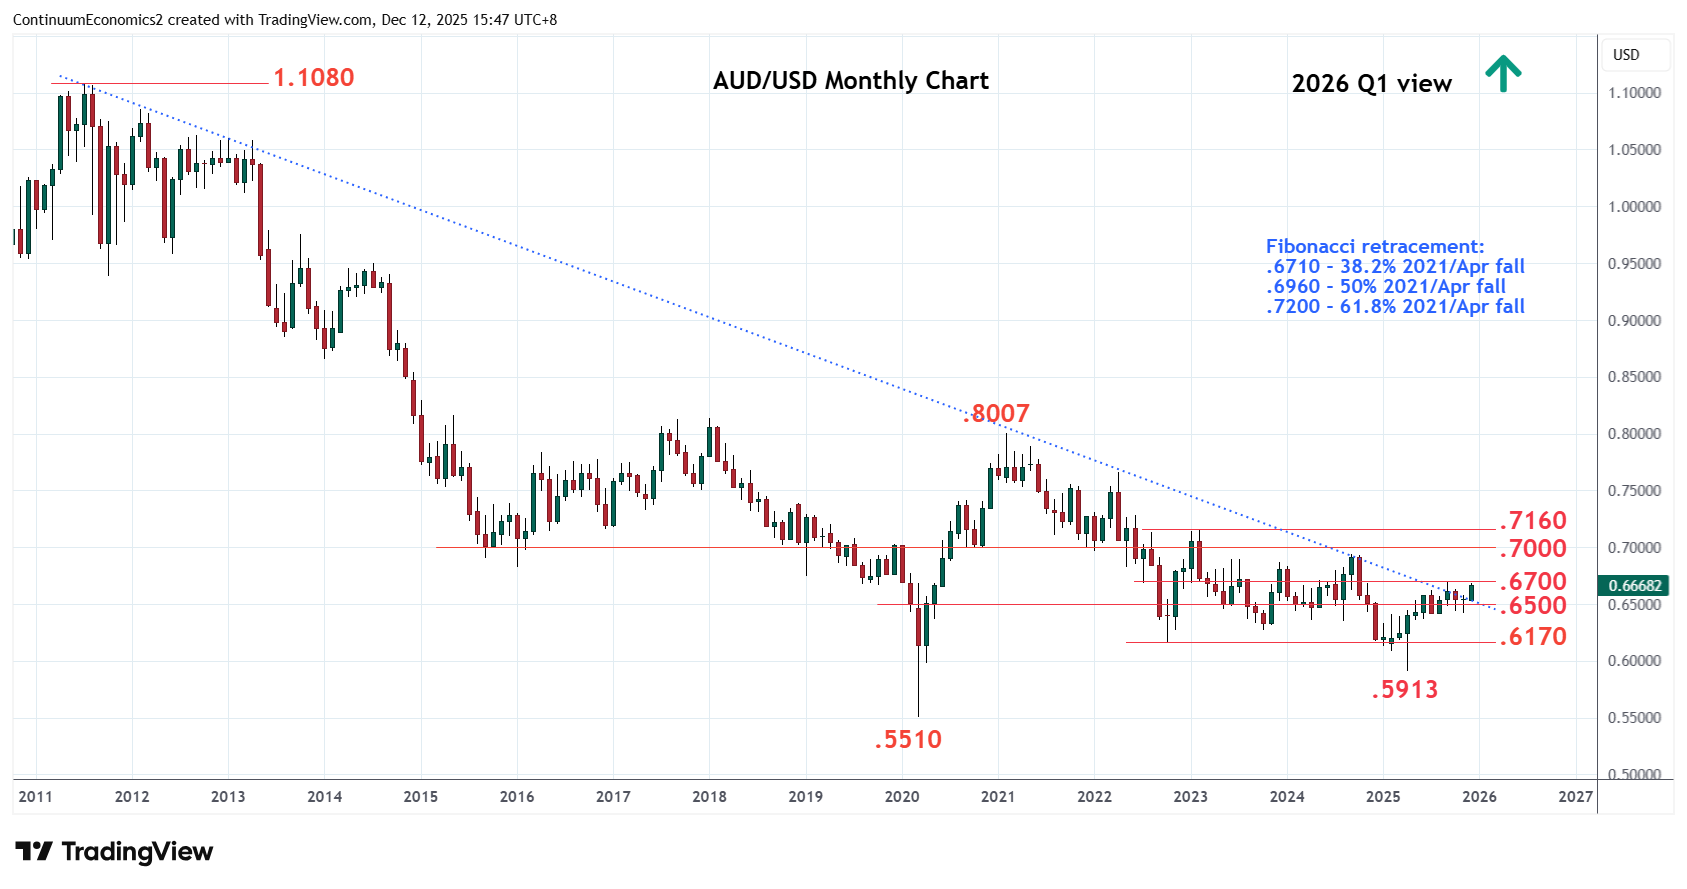
Meanwhile, support is raised to the .6550/.6500 congestion area which coincides with trend-line break from the 2021 and 2011 year highs. This area and the .6415 August/November lows area expected to underpin and sustain bullish gains from the .5913, April current year low.

Continue to read the article for free
Login

or

or

Topics
Technical Analysis
AUD/USD-TA
ChartBook

GENERAL

  • Home
  • About Us
  • Our Team
  • Careers

LEGAL

  • Terms and Conditions
  • Privacy Policy
  • Compliance
  • GDPR

GET IN TOUCH

  • Contact Us
Continuum Economics
The Technical Analyst Awards Winner 2021
The Technical Analyst Awards Finalist 2020
image