Published: 2026-03-27T14:15:02.000Z
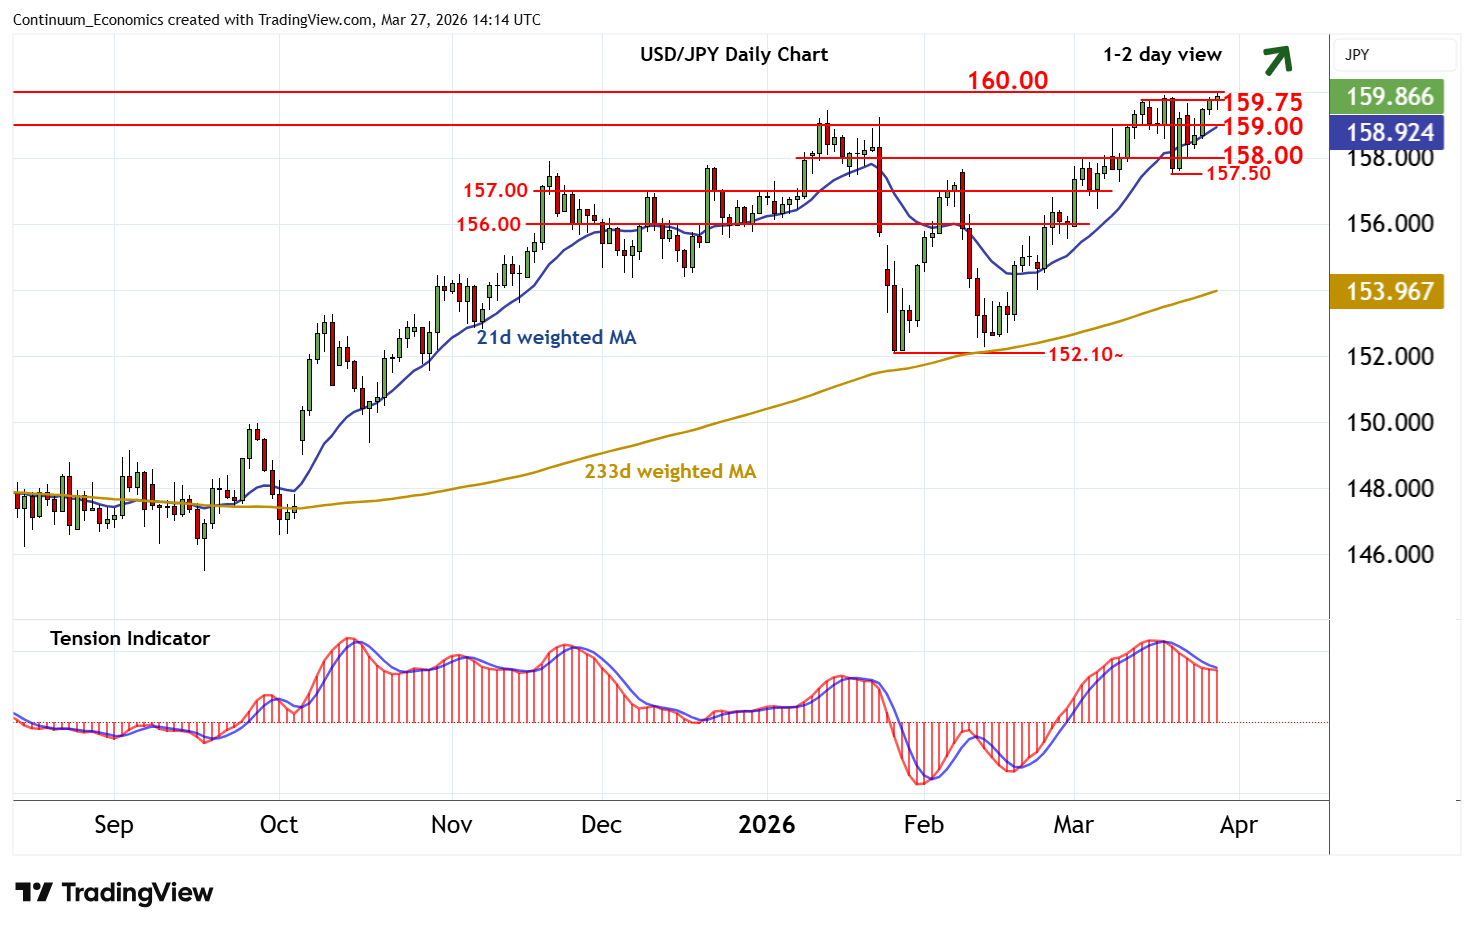
Chart USD/JPY Update: Pressuring strong resistance at 159.75/00
2
Little change, as prices extend pressure on strong resistance at the 159.75 weekly high of 13 March and historic congestion around 160.00
| Levels | Imp | Comment | Levels | Imp | Comment | |||
|---|---|---|---|---|---|---|---|---|
| R4 | 161.95 | ** | July 2024 (y) high | S1 | 159.00 | * | congestion | |
| R3 | 161.00 | July 2024 congestion | S2 | 158.00 | * | break level | ||
| R2 | 160.00 | ** | historic congestion | S3 | 157.50 | * | 19 Mar (w) low | |
| R1 | 159.75 | ** | 13 Mar (w) high | S4 | 157.00 | congestion |
Asterisk denotes strength of level
13:50 GMT - Little change, as prices extend pressure on strong resistance at the 159.75 weekly high of 13 March and historic congestion around 160.00. Daily readings are turning higher and broader weekly charts are positive, highlighting room for further strength in the coming sessions. A close above here will turn sentiment positive and extend September 2024 gains towards July 2024 congestion around 161.00. Meanwhile, support remains at congestion around 159.00 and should underpin any immediate setbacks.