Published: 2025-07-03T02:44:23.000Z
Chart USD/IDR Updates: Consolidating at 16200

Technical Analyst
-
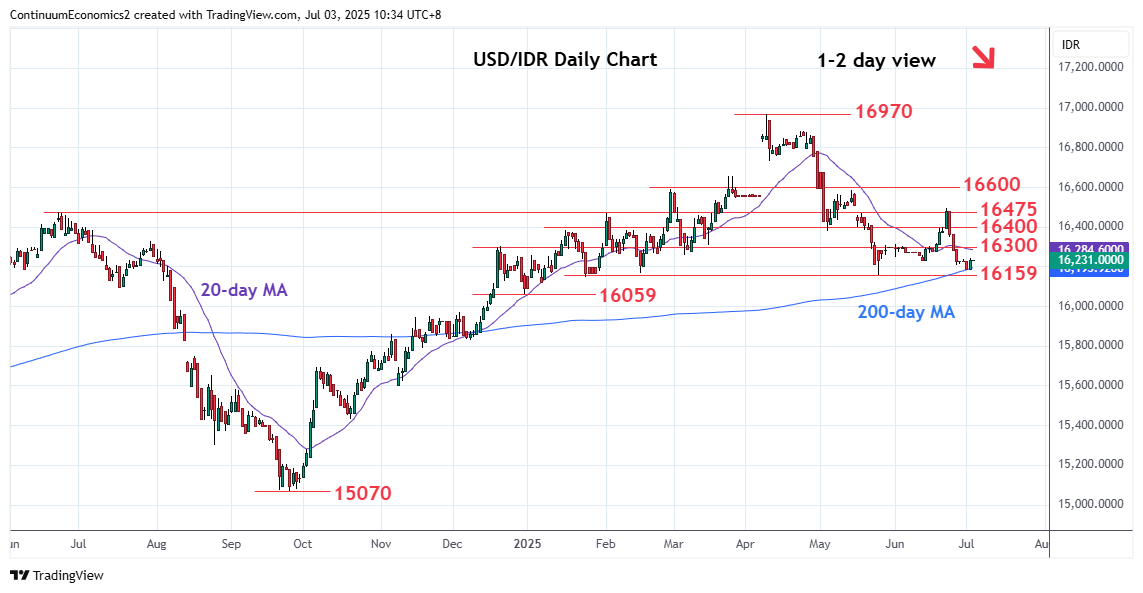
Limited on break of the 16200 level as prices turned up in consolidation above the 16159, May low
| Levels | Imp | Comment | Levels | Imp | Comment | |||
|---|---|---|---|---|---|---|---|---|
| R4 | 16584 | ** | 14 May high | S1 | 16159 | ** | May low | |
| R3 | 16495 | ** | 23 Jun high | S2 | 16059 | * | 31 Dec low | |
| R2 | 16400 | * | congestion | S3 | 16000 | * | 50% Sep/Apr rally | |
| R1 | 16300 | * | congestion | S4 | 15970 | * | 4 Dec high |
Asterisk denotes strength of level
02:45 GMT - Limited on break of the 16200 level as prices turned up in consolidation above the 16159, May low. Negative daily studies weighs but oversold readings suggest consolidation here likely before giving way to renewed selling pressure. Break here will confirm a top in place at the 16970 April high and further extend losses to retrace the September/April rally. Lower will see extension to 16059 support then the 16000 level and 50% Fibonacci level. Meanwhile, resistance is at the 16300 congestion which is expected to cap and sustain losses from the 16475/16495 highs.