Published: 2025-12-17T08:34:50.000Z
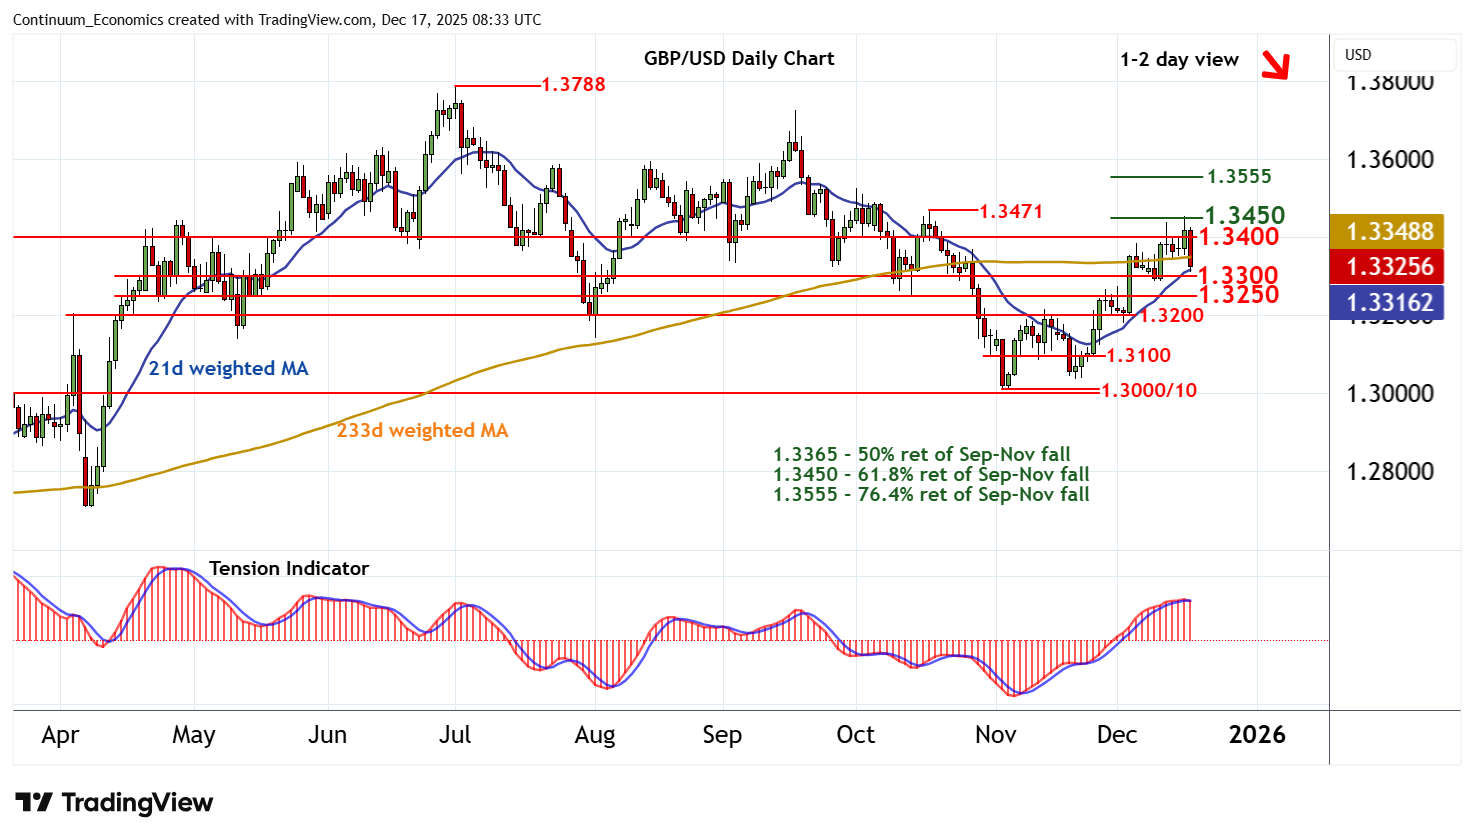
Chart GBP/USD Update: Sharp pullback from the 1.3450 Fibonacci retracement
3
The break above congestion resistance at 1.3400 has reached the 1.3450 Fibonacci retracement
| Level | Comment | Level | Comment | |||||
|---|---|---|---|---|---|---|---|---|
| R4 | 1.3500 | * | congestion | S1 | 1.3300 | * | congestion | |
| R3 | 1.3471 | * | 17 Oct (w) high | S2 | 1.3250 | * | congestion | |
| R2 | 1.3450 | ** | 61.8% ret of Sep-Nov fall | S3 | 1.3200 | * | congestion | |
| R1 | 1.3400 | ** | congestion | S4 | 1.3150 | * | congestion |
Asterisk denotes strength of level
08:10 GMT - The break above congestion resistance at 1.3400 has reached the 1.3450 Fibonacci retracement, where sharp selling interest has pushed prices lower towards congestion support at 1.3300. Intraday studies are falling and daily readings continue to track lower, highlighting room for further losses in the coming sessions. A break below 1.3300 will add weight to sentiment and open up congestion around 1.3250. But rising weekly charts should limit any deeper losses in renewed buying interest/consolidation above 1.3200. Meanwhile, resistance within 1.3400/50 should cap any immediate tests higher.