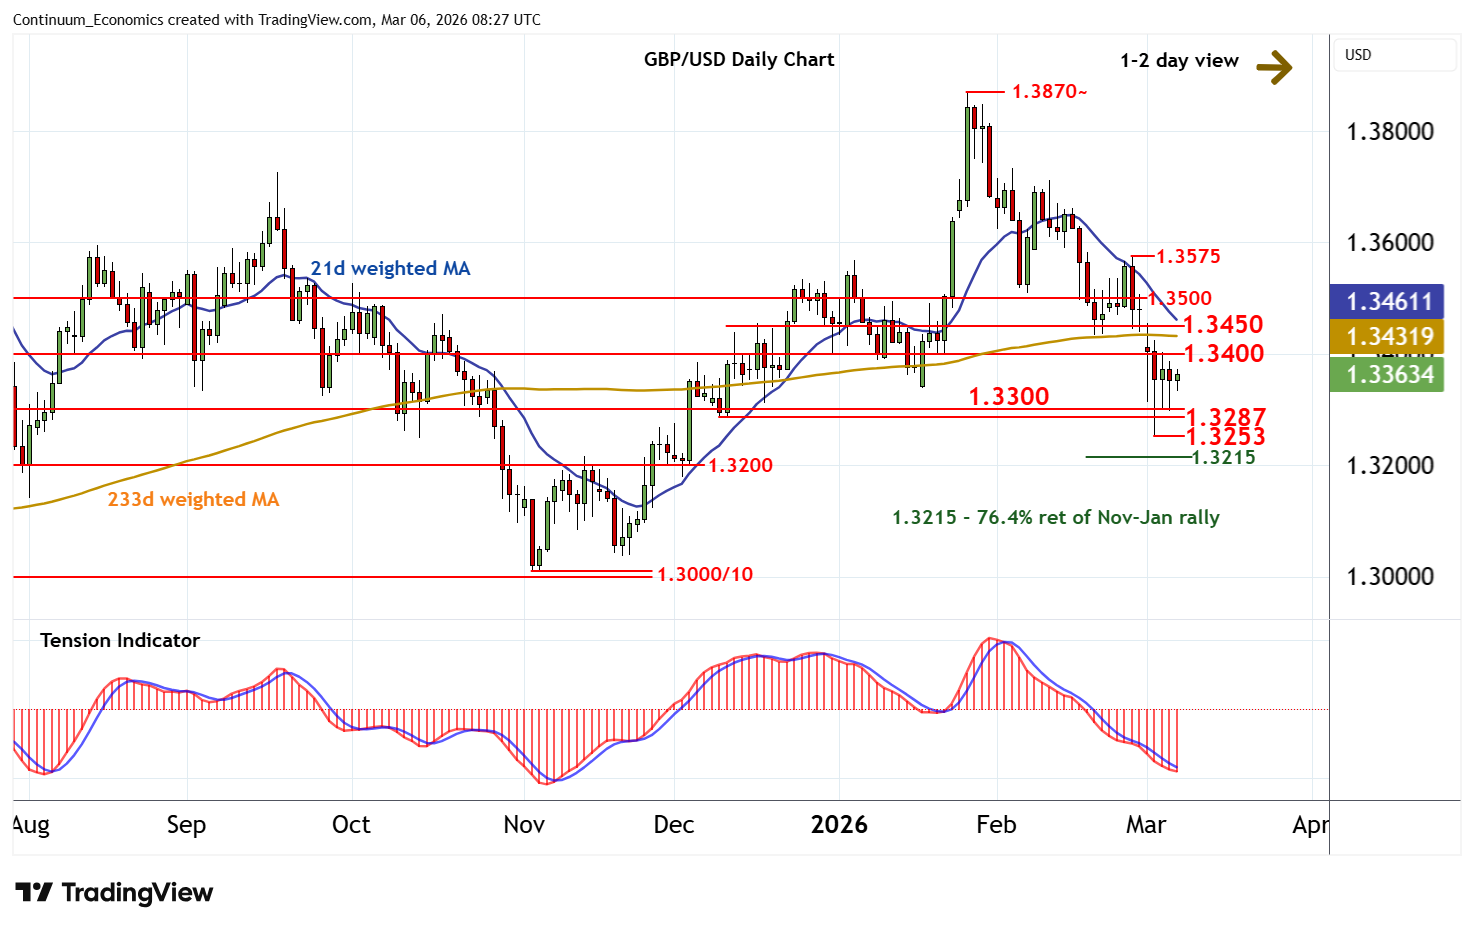
Chart GBP/USD Update: Choppy in range
The retest of support at the 1.3287 weekly low of 9 December and congestion around 1.3300 is giving way to a bounce to 1.3365, where mixed intraday studies are prompting consolidatio
| Level | Comment | Level | Comment | |||||
|---|---|---|---|---|---|---|---|---|
| R4 | 1.3600 | * | congestion | S1 | 1.3300 | * | congestion | |
| R3 | 1.3500 | ** | congestion | S2 | 1.3287 | * | 9 Dec (w) low | |
| R2 | 1.3450 | ** | congestion | S3 | 1.3253 | 3 Mar YTD low | ||
| R1 | 1.3400 | ** | congestion | S4 | 1.3200/15 | ** | congestion; 76.4% ret |
Asterisk denotes strength of level
08:10 GMT - The retest of support at the 1.3287 weekly low of 9 December and congestion around 1.3300 is giving way to a bounce to 1.3365, where mixed intraday studies are prompting consolidation. Oversold daily stochastics are turning higher and the bearish daily Tension Indicator is flattening, suggesting potential for a test of congestion resistance at 1.3400. But negative weekly charts and deteriorating longer-term readings should limit any break in renewed selling interest towards further congestion around 1.3450. In the coming sessions, further cautious trade is looked for, before prices turn lower once again. A later close below 1.3287/00 will open up the 1.3253 current year low of 3 March, with further selling adding weight to sentiment and extending late-January losses towards congestion around 1.3200 and the 1.3215 Fibonacci retracement.