Published: 2026-01-13T01:38:19.000Z
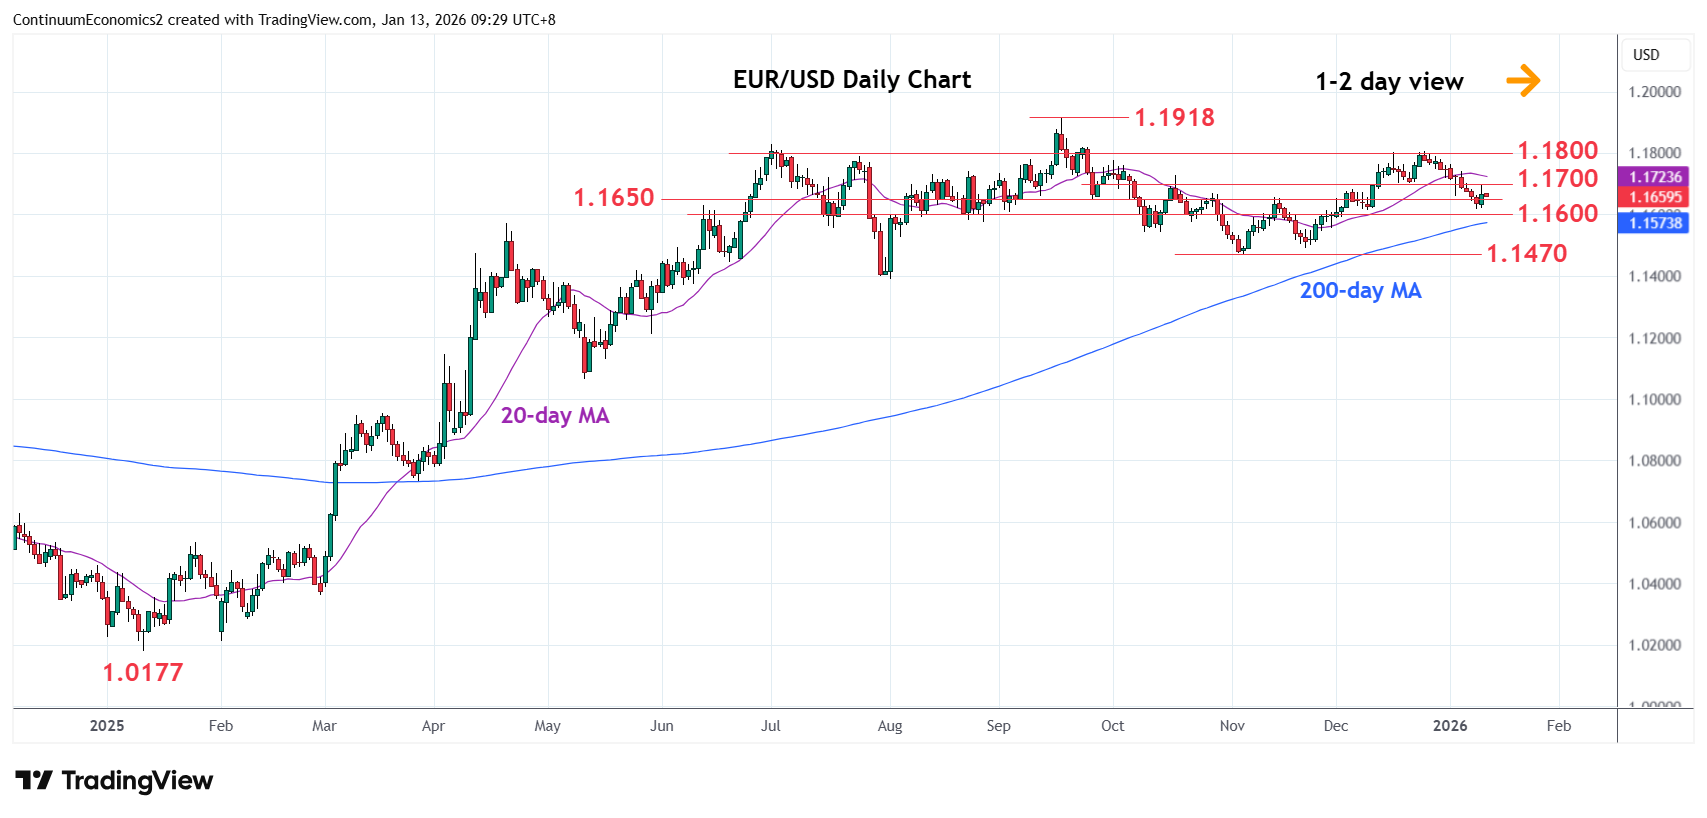
Chart EUR/USD Update: Extend consolidation above 1.1615/00 support
-
Saw bounce from above the 1.1615/00 support as prices consolidate losses from the 1.1800, December high
| Levels | Imp | Comment | Levels | Imp | Comment | |||
|---|---|---|---|---|---|---|---|---|
| R4 | 1.1918 | ** | 17 Sep 2025 year high | S1 | 1.1615/00 | ** | 9 Dec low, congestion | |
| 14 | 1.1800/30 | ** | congestion, Jul high | S2 | 1.1550 | * | congestion | |
| R2 | 1.1750 | * | congestion | S3 | 1.1500 | * | figure | |
| R1 | 1.1700 | * | congestion | S4 | 1.1470 | ** | Nov low |
Asterisk denotes strength of level
01:30 GMT - Saw bounce from above the 1.1615/00 support as prices consolidate losses from the 1.1800, December high. Gains has met with selling pressure at the 1.1700 resistance but a later break here cannot be ruled out as daily studies unwind oversold readings. Break, if seen, will return focus to the upside and sets up scope for retest of the 1.1750 congestion then the 1.1800, December high. Meanwhile, support at 1.1615/00 now underpin. Would take break here to open up room for deeper pullback to 1.1550 and 1.1500 congestion area.