Published: 2025-03-12T07:45:09.000Z
Chart EUR/AUD Update: Extending gains

Technical Analyst
-
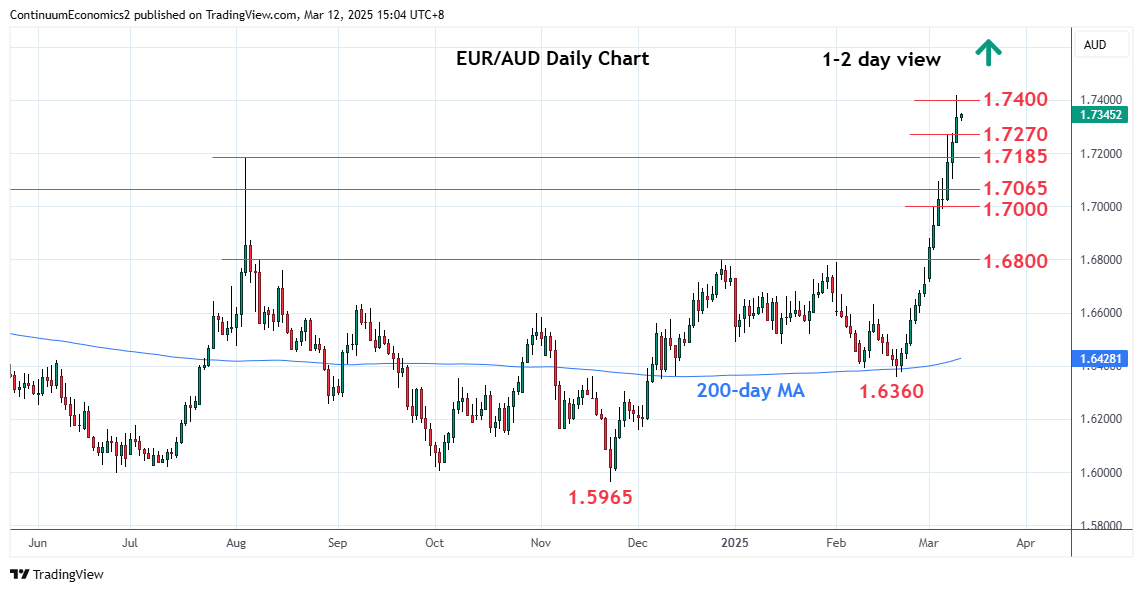
Extending gains with the parabolic rally from the 1.6360 February YTD low reaching fresh high at the 1.7400 level

| Levels | Imp | Comment | Levels | Imp | Comment | |||
|---|---|---|---|---|---|---|---|---|
| R4 | 1.7690 | * | 61.8% 2020/2022 fall | S1 | 1.7270 | * | 7 Mar high | |
| R3 | 1.7600 | * | congestion | S2 | 1.7185 | ** | Aug 2024 year high | |
| R2 | 1.7505 | * | 9 Apr 2020 high | S3 | 1.7065 | ** | Aug 2023 year high | |
| R1 | 1.7400 | * | congestion | S4 | 1.7000 | * | 4 Mar high, congestion |
Asterisk denotes strength of level
07:40 GMT - Extending gains with the parabolic rally from the 1.6360 February YTD low reaching fresh high at the 1.7400 level. Higher still will see scope to the 1.7505, 9 April 2020 high. Higher still, will see room to the 1.7600 congestion then the 1.7690, 61.8% Fibonacci level. However, deep overbought daily studies caution corrective pullback with support now raised to the 1.7270 high of last week. Would take break here to open up room for deeper pullback to the strong support at the 2024/2023 year highs at 1.7185 and 1.7065.