Published: 2026-04-28T07:52:24.000Z
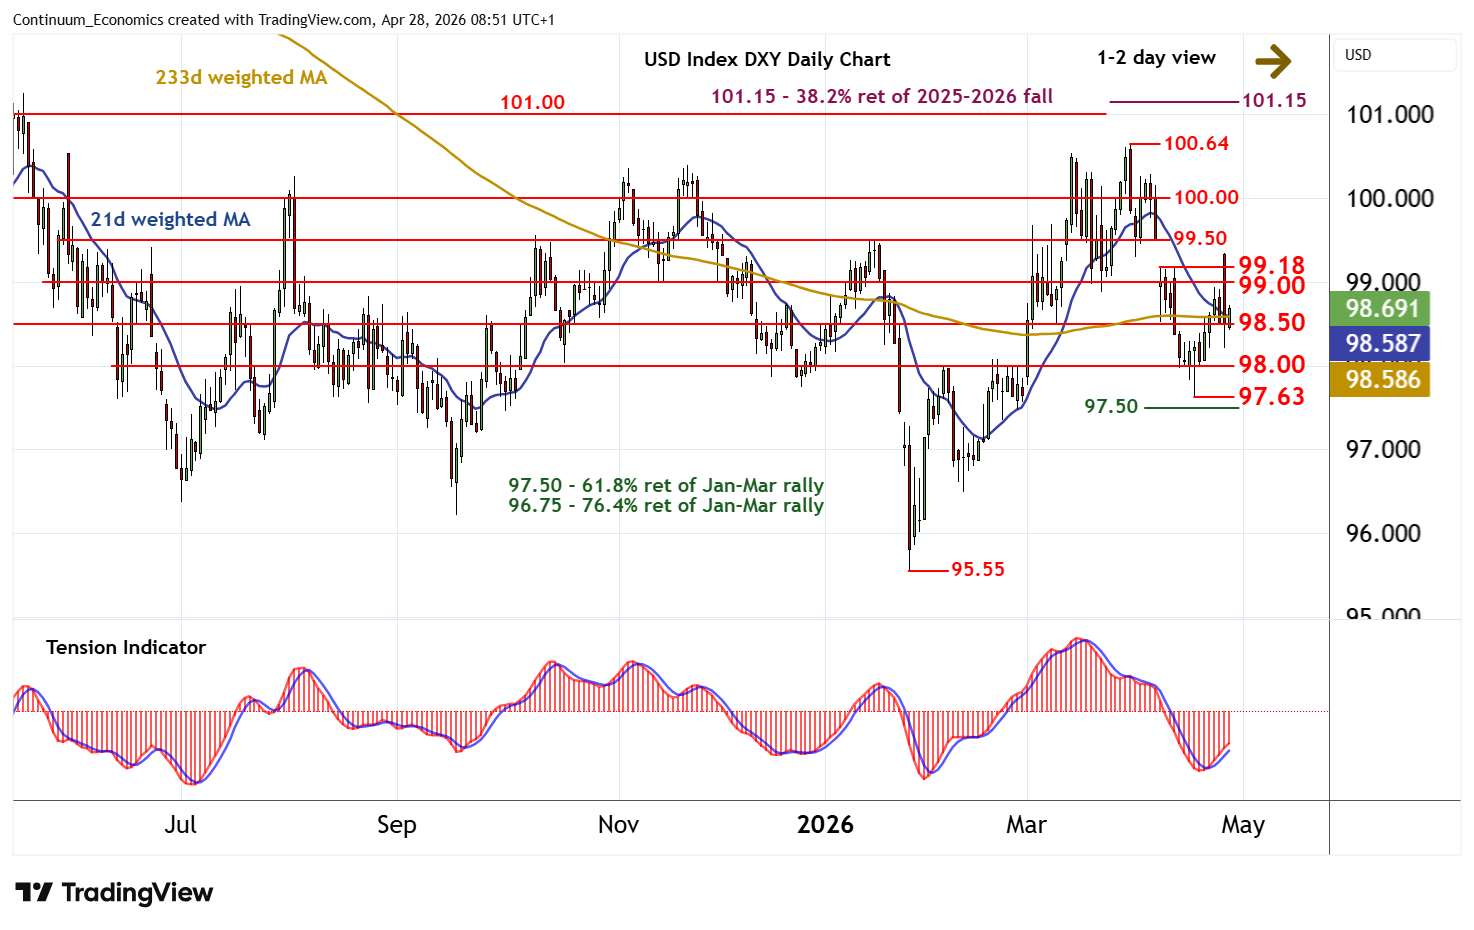
Chart USD Index DXY Update: Back in range
1
The break below 98.50 has bounced from 98.20~
| Levels | Imp | Comment | Levels | Imp | Comment | |||
|---|---|---|---|---|---|---|---|---|
| R4 | 100.64 | ** | 31 Mar YTD high | S1 | 98.50 | * | congestion | |
| R3 | 100.00 | ** | congestion | S2 | 98.00 | ** | congestion | |
| R2 | 99.50 | * | congestion | S3 | 97.63 | * | 17 Apr (w) low | |
| R1 | 99.00/18 | ** | congestion; 8 Apr high | S4 | 97.50 | ** | congestion; 61.8% ret |
Asterisk denotes strength of level
08:45 BST - The break below 98.50 has bounced from 98.20~, as as oversold intraday stochastics unwind, with steady gains posting a break back above 98.50 to trade around 98.65. Rising daily stochastics and the positive daily Tension Indicator highlight room for continuation towards strong resistance within the 99.00/18 range. But mixed/negative weekly charts should limit any initial tests in renewed consolidation. A close above here, however, would improve sentiment and extend mid-April gains towards congestion around 99.50. Meanwhile, any fresh tests below congestion support at 98.50 should be limited in consolidation above further congestion around 98.00.