Published: 2026-03-30T00:20:24.000Z
Chart AUD/USD Update: Extending losses
1
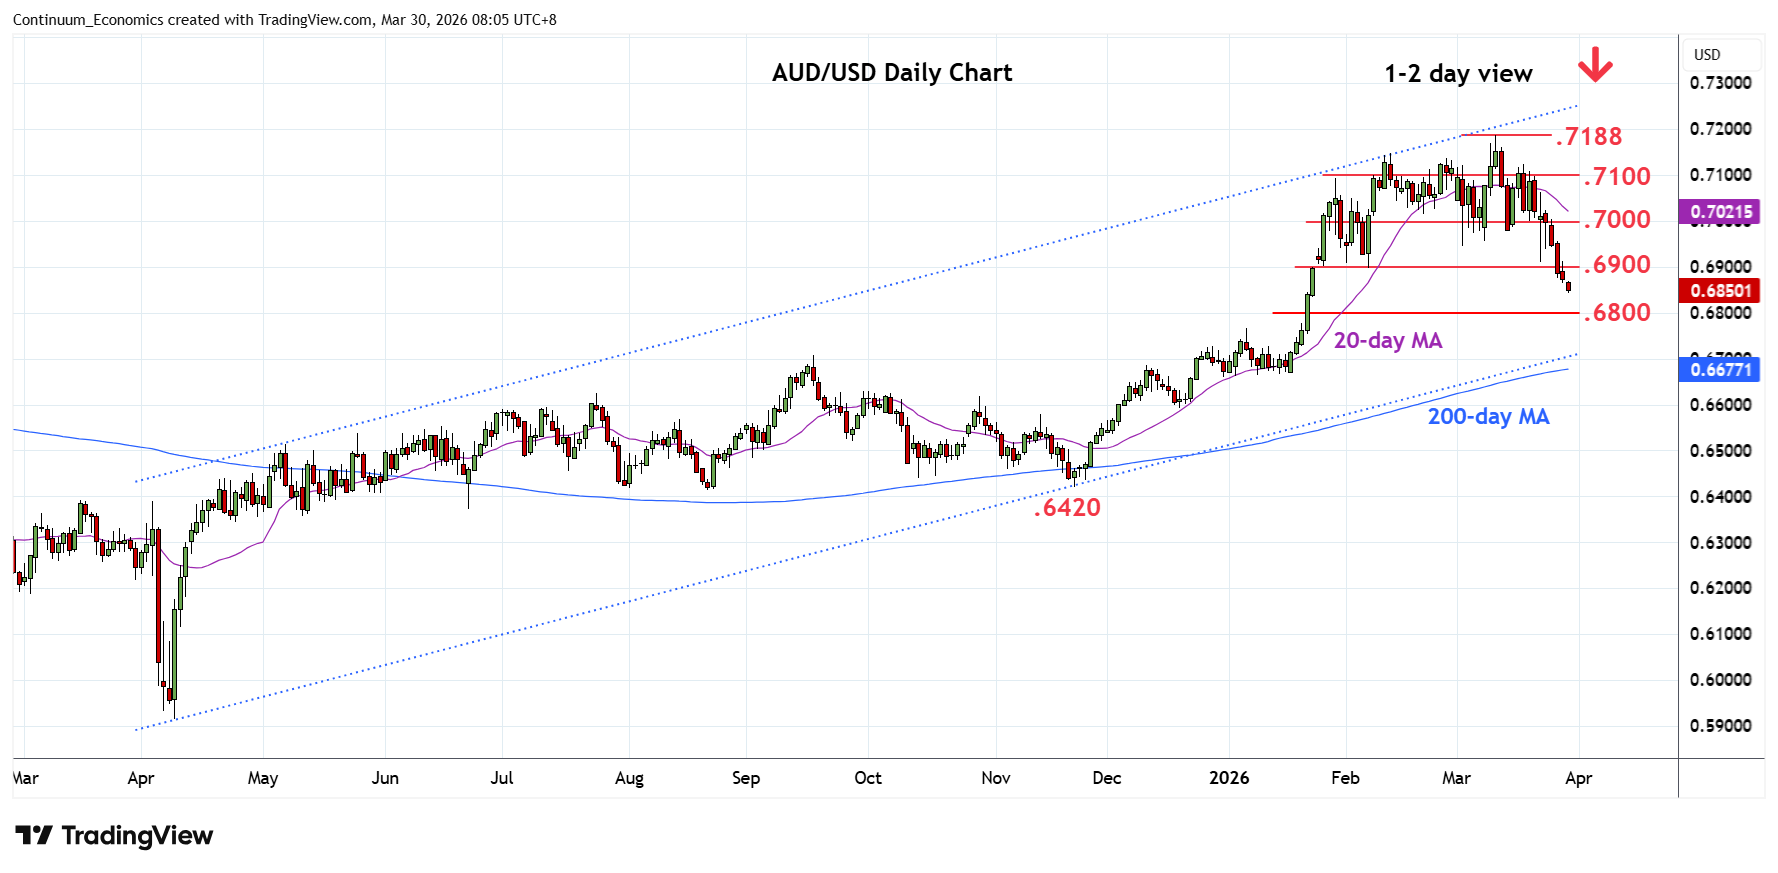
Following-through on the losses last week through the .6945/.6910 lows to extend losses from the .7188, 11 March current year high
| Levels | Imp | Comment | Levels | Imp | Comment | |||
|---|---|---|---|---|---|---|---|---|
| R4 | 0.7050 | * | congestion | S1 | 0.6805/00 | * | 50%, congestion | |
| R3 | 0.7000 | ** | congestion | S2 | 0.6765 | * | 7 Jan high | |
| R2 | 0.6950 | * | congestion | S3 | 0.6715 | * | 61.8% Nov/Mar rally | |
| R1 | 0.6900 | * | congestion | S4 | 0.6707/00 | ** | Sep high, channel |
Asterisk denotes strength of level
00:15 GMT - Following-through on the losses last week through the .6945/.6910 lows to extend losses from the .7188, 11 March current year high. Bearish momentum suggest room to further retrace gains from the November low within the bullish channel from the April 2025 year low to .6805, 50% Fibonacci retracement. Meanwhile, resistance is lowered to the .6900 congestion area which is expected to cap. Above here will ease the downside pressure and see room for extension to strong resistance at the .6950/.7000 congestion area.