Chart USD/JPY Update: Higher in JPY-driven trade
The bounce from the 154.34 weekly low of 5 December is extending in JPY-driven trade
| Levels | Imp | Comment | Levels | Imp | Comment | |||
|---|---|---|---|---|---|---|---|---|
| R4 | 160.00 | ** | break level | S1 | 156.00 | * | congestion | |
| R3 | 158.88 | ** | 10 Jan YTD high | S2 | 155.00 | * | break level | |
| R2 | 157.90/00 | * | 20 Nov (m) high; break level | S3 | 154.34 | * | 5 Dec (w) low | |
| R1 | 156.75 | * | 26 Nov high | S4 | 154.00 | * | break level |
Asterisk denotes strength of level
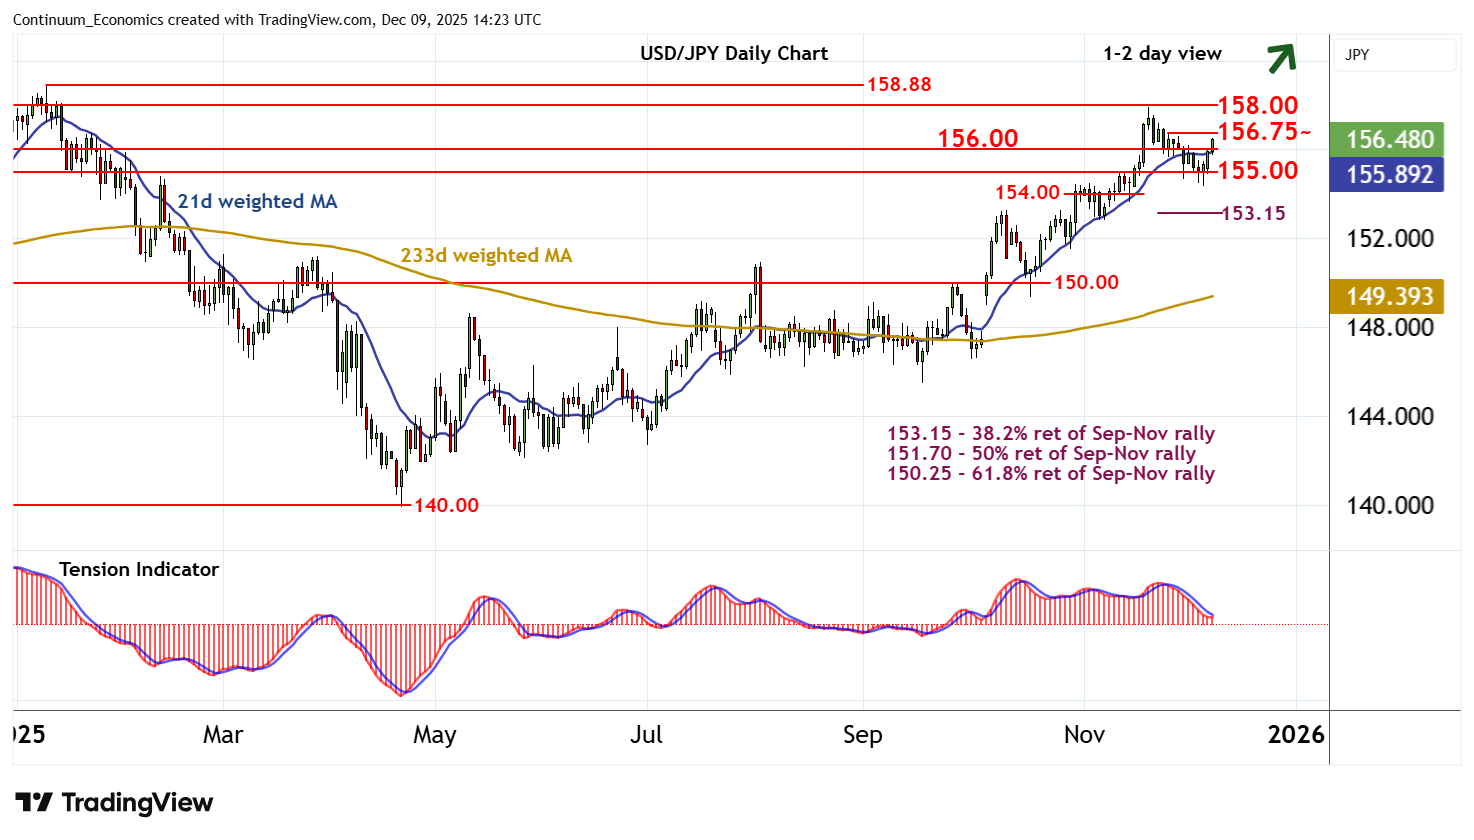
14:05 GMT - The bounce from the 154.34 weekly low of 5 December is extending in JPY-driven trade, with focus on resistance at the 156.75 high of 26 November. Intraday studies are flat in overbought areas, suggesting any immediate tests could give way to consolidation. However, oversold daily stochastics are unwinding and the negative daily Tension Indicator is flattening, suggesting potential for a break above here towards stronger resistance at the 157.90 monthly high of 20 November and the 158.00 break level. However, flattening positive weekly readings are expected to limit any initial tests in profit-taking/consolidation. Meanwhile, support is at congestion around 156.00 and extends to 155.00. A close beneath here is needed to turn sentiment negative and confirm continuation of November losses.