Published: 2025-07-03T06:44:32.000Z
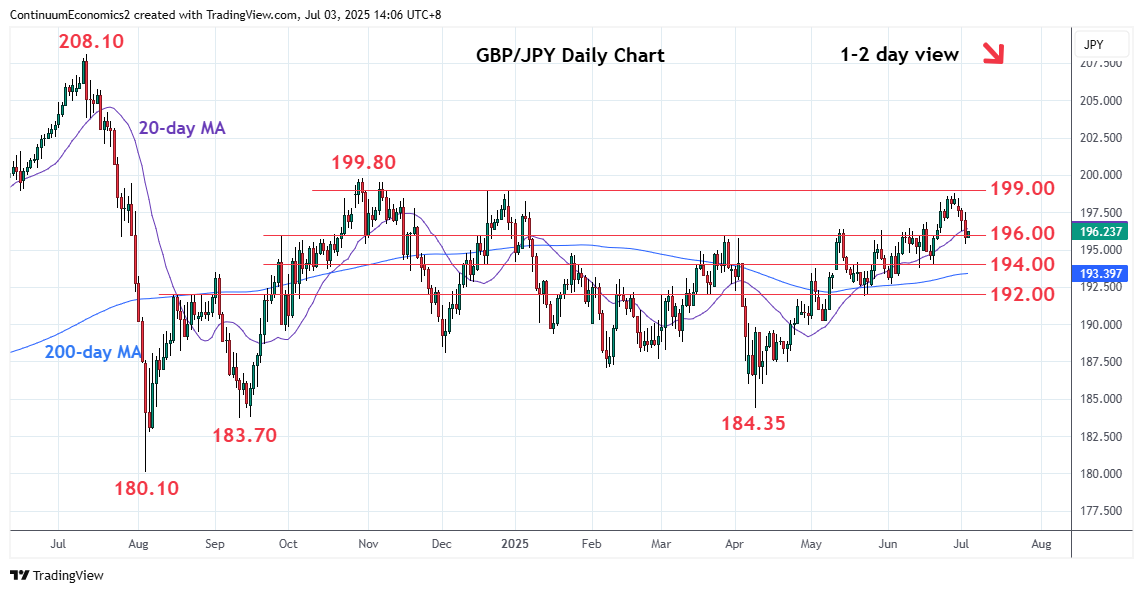
Chart GBP/JPY Update: Extending pullback from 198.80, June high

Technical Analyst
1
Sharply lower through the 196.40/196.00 area as prices extend pullback from the 198.80 high to retrace the April/June rally
| Levels | Imp | Comment | Levels | Imp | Comment | |||
|---|---|---|---|---|---|---|---|---|
| R4 | 200.70 | * | 23 Jul 2024 low | S1 | 195.00 | * | congestion | |
| R3 | 199.80 | ** | Oct high | S2 | 194.00 | ** | congestion | |
| R2 | 198.80/00 | ** | 27 Jun YTD high, congestion | S3 | 193.30 | * | 38.2% Apr/Jun rally | |
| R1 | 197.50 | * | 2 Jul high | S4 | 192.00 | * | 22 May low, congestion |
Asterisk denotes strength of level
06:40 GMT - Sharply lower through the 196.40/196.00 area as prices extend pullback from the 198.80 high to retrace the April/June rally. Daily and weekly studies have turned down from overbought areas and below the 195.00 congestion will see room for deeper pullback to the 194.00 congestion then 193.30, 38.2% Fibonacci level. Lower still, will turn focus to support at the 192.70/192.00 area. Meanwhile, resistance is lowered to 197.50 mid-week high which is expected to cap and sustain losses from the 198.80 high.