Published: 2026-02-27T08:17:06.000Z
Chart EUR/AUD Update: Extending losses
1
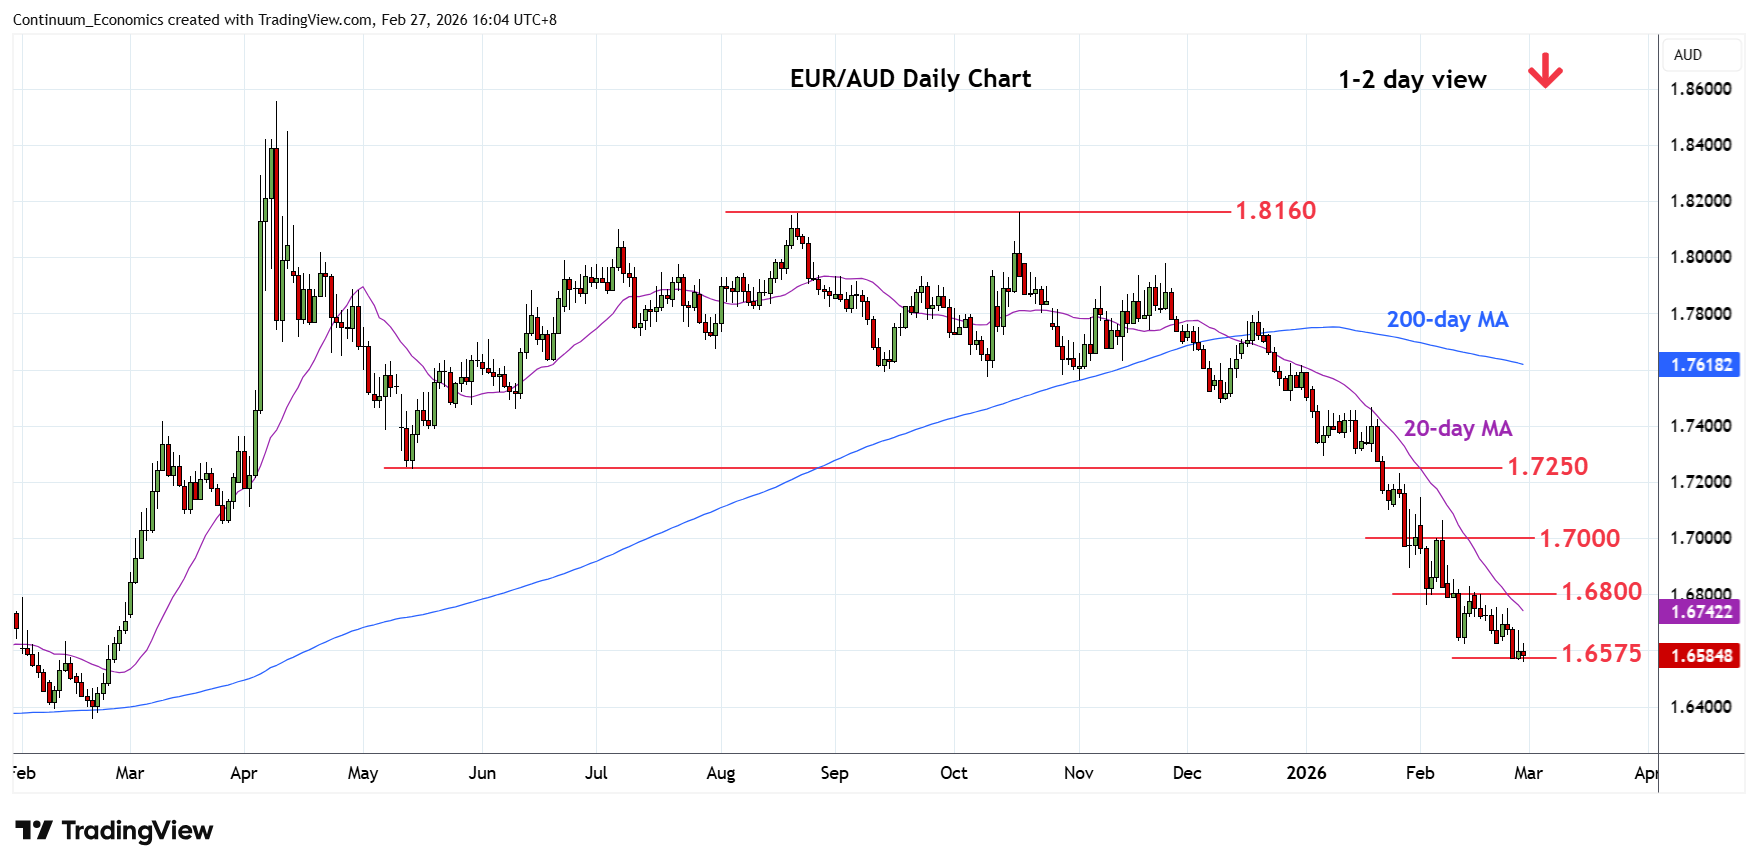
Pressure remains on the downside and break of the 1.6575 Fibonacci level see prices extending losses from the 1.7590, January high
| Levels | Imp | Comment | Levels | Imp | Comment | |||
|---|---|---|---|---|---|---|---|---|
| R4 | 1.7000 | * | figure, congestion | S1 | 1.6500 | * | congestion | |
| R3 | 1.6900 | * | congestion | S2 | 1.6420 | * | 50% 2022/2025 rally | |
| R2 | 1.6800 | * | congestion | S3 | 1.6400 | * | congestion | |
| R1 | 1.6700/50 | * | congestion | S4 | 1.6355 | ** | 20 Feb 2025 year low |
Asterisk denotes strength of level
08:15 GMT - Pressure remains on the downside and break of the 1.6575 Fibonacci level see prices extending losses from the 1.7590, January high. Lower will further extend losses to the strong support at 1.6420/00, Fibonacci level and congestion area, then the 1.6355, February 2025 year low. However, oversold daily and weekly studies caution corrective bounce with bounce to see resistance starting at the 1.6700/50 congestion area. Would need lift over this to ease the downside pressure and clear the way for stronger corrective bounce to retrace sharp losses from the January high.