Published: 2025-06-20T05:31:35.000Z
Chart USD/INR Update: Lower in consolidation from 86.9000 level

Technical Analyst
1
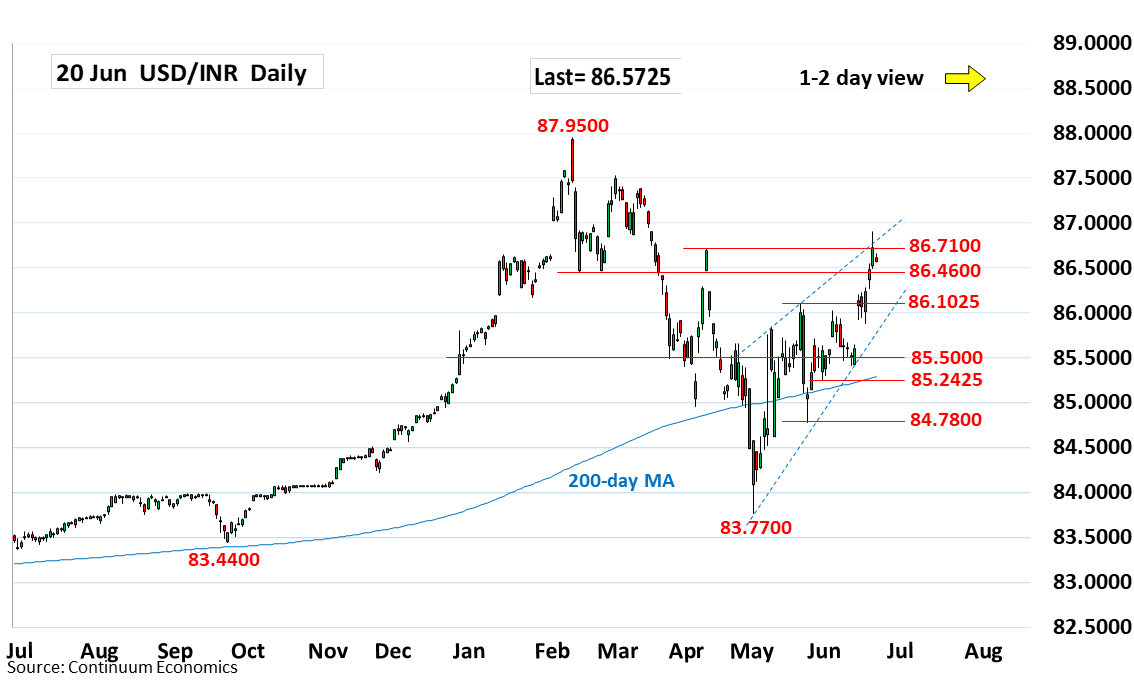
Lower in range from the 86.9000 high as prices consolidate test of the upper wedge pattern
| Level | Comment | Level | Comment | |||||
|---|---|---|---|---|---|---|---|---|
| R4 | 87.5300 | ** | 28 Feb high | S1 | 86.4600 | * | Feb low | |
| R3 | 87.3850 | * | Mar high | S2 | 86.1025 | * | May high | |
| R2 | 87.0000 | * | congestion | S3 | 85.9200 | * | 13 Jun low | |
| R1 | 86.7100 | * | Apr high | S4 | 85.6475 | * | 12 Jun high, gap |
Asterisk denotes strength of level
05:25 GMT - Lower in range from the 86.9000 high as prices consolidate test of the upper wedge pattern and unwind overbought intraday studies. Daily studies are stretched as well and suggest room for deeper pullback to retrace strong gains from the 85.6475 low of last week. Support is at 86.5000/86.4600 area and break here will open up room to 86.1025/86.0000 area. Lower still will see the gap at 85.9200/85.6475 attracting. Meanwhile, resistance is raised to 86.7100, high of April. Break here and the 86.9000 high needed to further extend gains from the May low.