Published: 2025-03-18T05:40:02.000Z
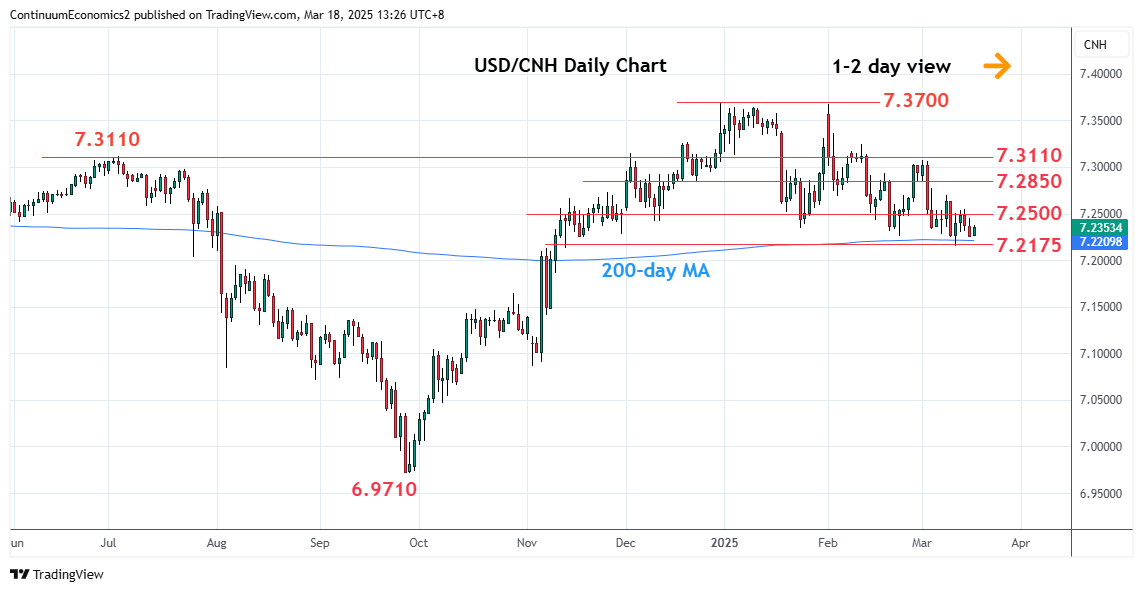
Chart USD/CNH Update: Under pressure

Technical Analyst
-
Leaning lower to pressure the 7.2175/55, 38.2% Fibonacci level and low of last week

| Level | Imp | Comment | Level | Imp | Comment | |||
|---|---|---|---|---|---|---|---|---|
| R4 | 7.3070 | ** | 3 Mar high | S1 | 7.2175/55 | ** | 38.2%, 12 Mar YTD low | |
| R3 | 7.2850 | * | congestion | S2 | 7.2000 | * | congestion | |
| R2 | 7.2700 | ** | 10 Mar high | S3 | 7.1860 | * | 11 Nov low | |
| R1 | 7.2500 | * | congestion | S4 | 7.1705 | * | 50% Sep/Dec rally |
Asterisk denotes strength of level
05:35 GMT - Leaning lower to pressure the 7.2175/55, 38.2% Fibonacci level and low of last week. However, intraday studies are stretched and suggest consolidation likely to unwind oversold readings. However, this is expected to give way to fresh selling pressure later to open up room for deeper pullback to retrace the September/December rally to the 7.2000 congestion. Lower still, will see room to 7.1860 and 7.1705, 50% Fibonacci level. Meanwhile, resistance at the 7.2500/7.2700 congestion expected to cap and sustain losses from the December/February highs.