Published: 2026-04-27T11:45:58.000Z
Chart USD/ZAR Update: Cautious trade
2
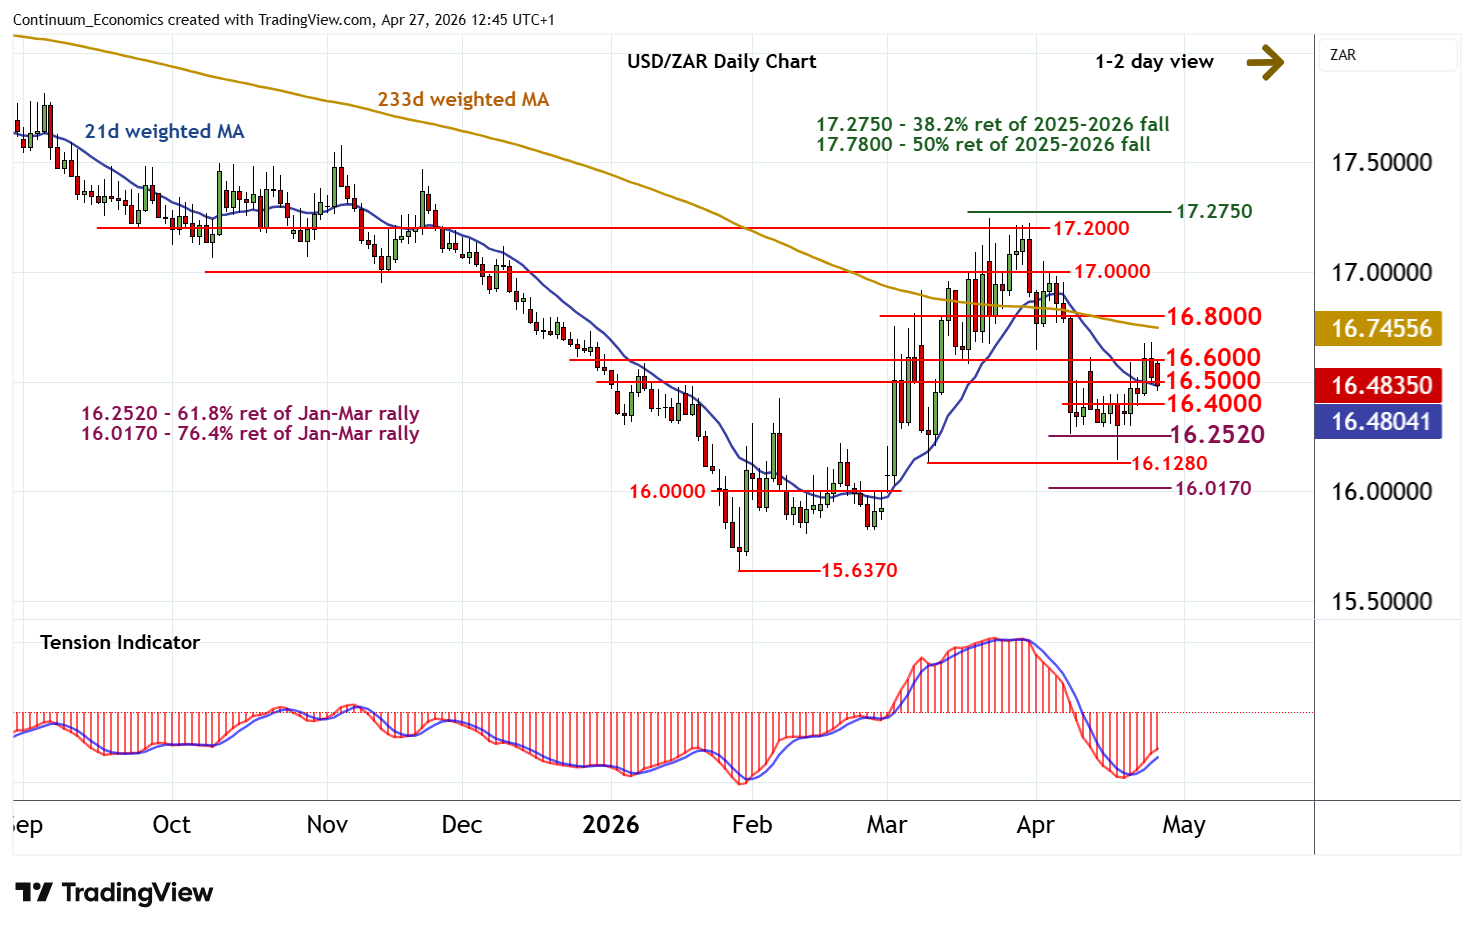
Cautious trade within resistance at 16.5000 - 16.6000 is giving way to a pullback
| Level | Comment | Level | Comment | |||||
|---|---|---|---|---|---|---|---|---|
| R4 | 17.0000 | * | congestion | S1 | 16.4000 | congestion | ||
| R3 | 16.8000 | * | congestion | S2 | 16.2520 | ** | 61.8% ret of Jan-Mar rally | |
| R2 | 16.6000 | break level | S3 | 16.1280 | * | 10 Mar (w) low | ||
| R1 | 16.5000 | break level | S4 | 16.0170 | ** | 76.4% ret of Jan-Mar rally |
Asterisk denotes strength of level
12:25 BST - Cautious trade within resistance at 16.5000 - 16.6000 is giving way to a pullback, as intraday studies turn down, with prices currently trading just beneath 16.5000.Focus is on congestion around 16.4000. But rising daily readings should limit any initial tests in renewed consolidation. A break, however, will add weight to sentiment and open up critical support at the 16.2520 Fibonacci retracement. But mixed weekly charts should prompt consolidation above here. Meanwhile, a close above 16.6000 would help to improve price action and open up a test of congestion around 16.8000.