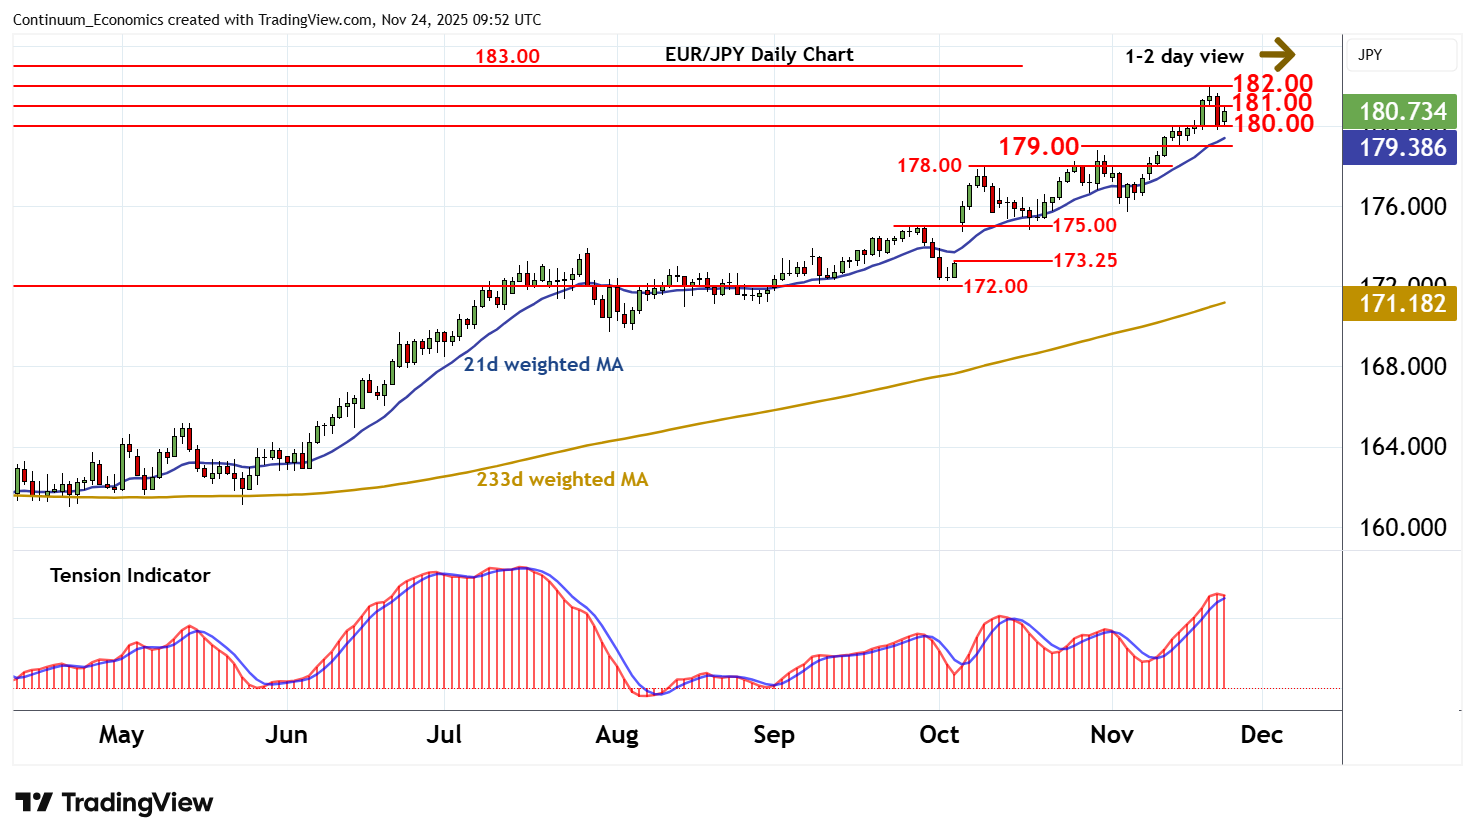
Chart EUR/JPY Update: Limited tests higher
The anticipated test of support at 180.00 has given way to a steady bounce
| Levels | Imp | Comment | Levels | Imp | Comment | |||
|---|---|---|---|---|---|---|---|---|
| R4 | 185.00 | * | figure | S1 | 180.00 | * | break level | |
| R3 | 183.00 | * | figure | S2 | 179.00 | * | break level | |
| R2 | 182.00 | * | 20 Nov YTD high, historic cong | S3 | 178.00 | break level | ||
| R1 | 181.00 | * | intraday break level | S4 | 176.00 | ** | break level |
Asterisk denotes strength of level
09:45 GMT - The anticipated test of support at 180.00 has given way to a steady bounce, as oversold intraday studies turn higher, with prices currently trading around 180.75. Overbought daily stochastics are unwinding and the positive daily Tension Indicator is turning down, highlighting room for further losses in the coming sessions. A break below 180.00 will open up the 179.00 break level. But positive weekly charts should limit any initial tests in consolidation. Meanwhile, resistance is at 181.00. But a close above critical resistance at the 182.00 current year high of 20 November and historic congestion, would improve sentiment and extend long-term gains towards 183.00.