Published: 2025-11-05T16:44:10.000Z
Chart USD/CAD Update: Focus on the 1.4170 Fibonacci retracement
1
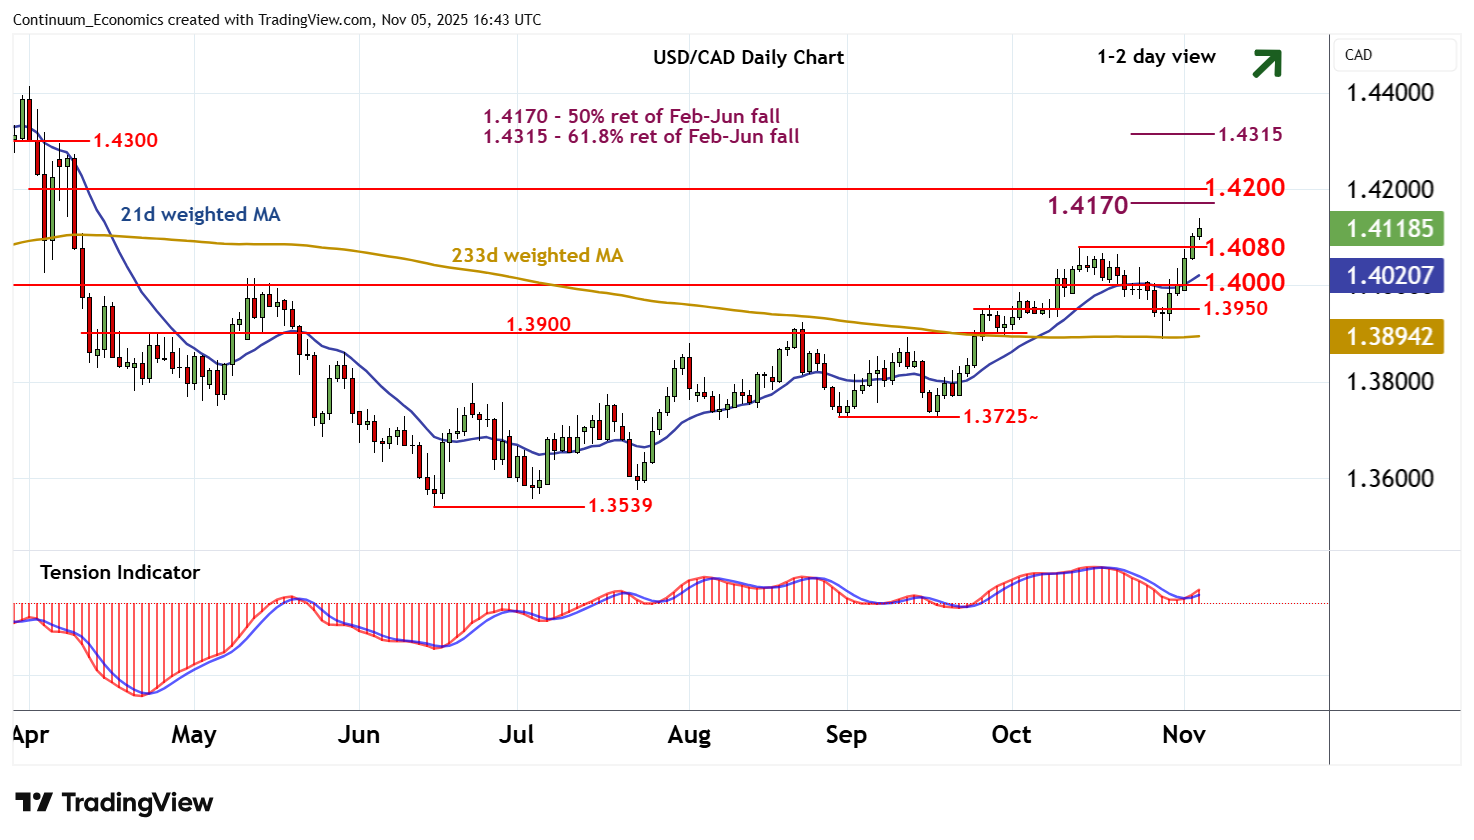
Anticipated USD- and CAD-driven gains have reached 1.4140
| Levels | Imp | Comment | Levels | Imp | Comment | |||
|---|---|---|---|---|---|---|---|---|
| R4 | 1.4315 | ** | 61.8% ret of Feb-Jun fall | S1 | 1.4080 | ** | 14 Oct (w) high | |
| R3 | 1.4300 | * | break level | S2 | 1.4000 | * | break level | |
| R2 | 1.4200 | * | congestion | S3 | 1.3950 | * | pivot | |
| R1 | 1.4170 | ** | 50% ret of Feb-Jun fall | S4 | 1.3900 | ** | break level, 50% ret |
Asterisk denotes strength of level
16:25 GMT - Anticipated USD- and CAD-driven gains have reached 1.4140, where unwinding overbought intraday studies are prompting short-term reactions. A minor pullback is highlighted, but rising daily charts and mixed/positive weekly readings are expected to prompt renewed buying interest towards support at the 1.4080 weekly high of 14 October. Following cautious/corrective trade, fresh gains are looked for, with June gains to focus on strong resistance at the 1.4170 Fibonacci retracement and congestion around 1.4200. However, already overbought weekly stochastics are expected to limit any initial tests in consolidation.