Chart USD/ZAR Update: Consolidating
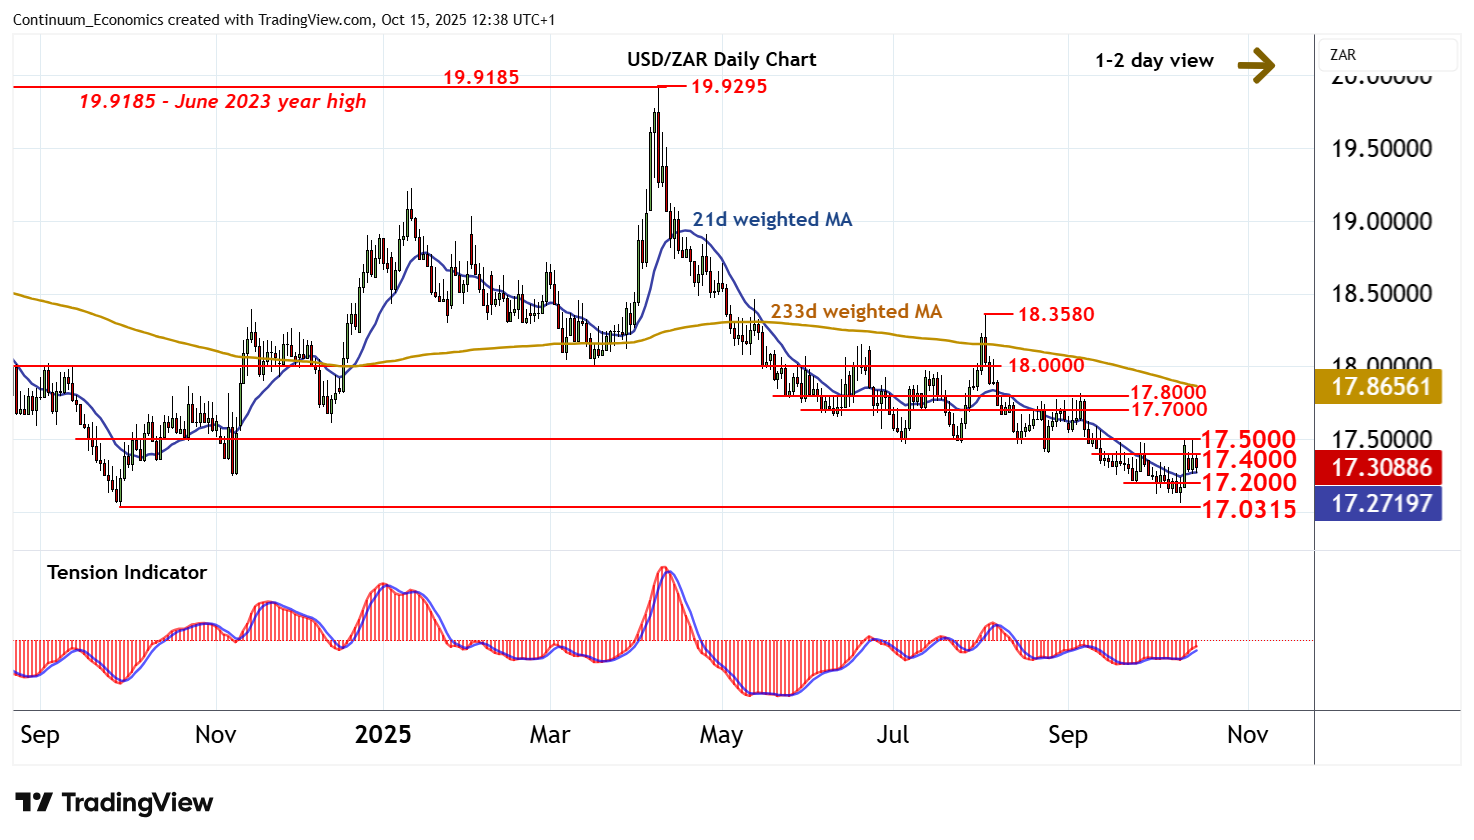
The retest of resistance within the 17.4000 - 17.5000 range has given way to a pullback
| Level | Comment | Level | Comment | |||||
|---|---|---|---|---|---|---|---|---|
| R4 | 17.8000 | * | congestion | S1 | 17.2000 | * | congestion | |
| R3 | 17.7000 | * | congestion | S2 | 17.0630 | * | 9 Oct YTD low | |
| R2 | 17.5000 | ** | congestion | S3 | 17.0315 | ** | 30 Sep 2024 (y) low | |
| R1 | 17.4000 | * | break level | S4 | 17.0000 | ** | congestion |
Asterisk denotes strength of level
12:20 BST - The retest of resistance within the 17.4000 - 17.5000 range has given way to a pullback, as intraday studies turn down, with prices currently trading around 17.3100. Daily stochastics are edging lower, suggesting potential for a test of congestion support at 17.2000. But the rising daily Tension Indicator and positive weekly charts should limit any deeper reactions in renewed buying interest above critical support within 17.0315 - 17.0630. Meanwhile, a close above congestion resistance at 17.5000 would improve sentiment and extend early-October gains towards further resistance within 17.7000 - 17.8000. However, by-then overbought daily stochastics could limit any initial tests in profit-taking/consolidation.