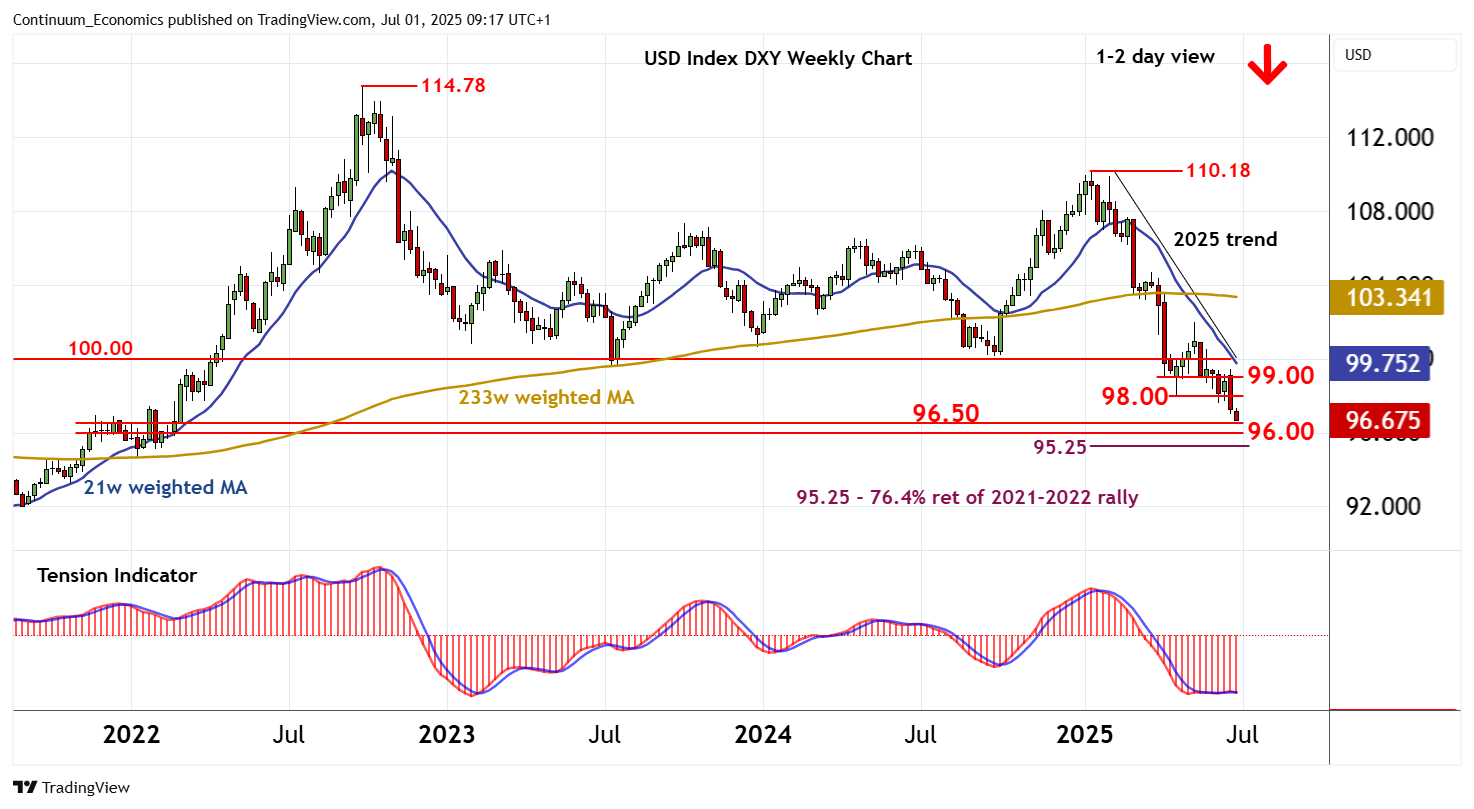
Chart USD Index DXY Update: Fresh year lows

Anticipated losses have posted a fresh year low at 96.61
| Levels | Imp | Comment | Levels | Imp | Comment | |||
|---|---|---|---|---|---|---|---|---|
| R4 | 99.50 | congestion | S1 | 96.61 | current year low | |||
| R3 | 99.00 | break level | S2 | 96.50 | * | congestion | ||
| R2 | 98.00 | * | congestion | S3 | 96.00 | ** | congestion | |
| R1 | 97.60 | * | 12 Jun (w) low | S4 | 95.25 | ** | 76.4% ret of 2021-2022 rally |
Asterisk denotes strength of level
09:10 BST - Anticipated losses have posted a fresh year low at 96.61, where short-term consolidation is developing. However, daily readings continue to point lower and both weekly and longer-term charts are under pressure, highlighting room for still further losses in the coming sessions. A break below congestion around 96.50 will add weight to sentiment and extend September 2022 losses towards 96.00. Extension to the 95.25 Fibonacci retracement cannot be ruled out, but already oversold weekly studies could limit any initial tests in consolidation. Meanwhile, resistance remains at congestion around 98.00. A close above here, if seen, will help to stabilise price action and prompt consolidation beneath 99.00.