Continuum Economics
  • Search
  • About Us
  • Buy
  • Invite A Friend
  • My Basket
  • Articles
  • Calendar
  • Forecasts
  • Events
  • Data
  • Newsletters
  • My Alerts
  • Community
  • Directory
  • About Us
  • Buy
  • Invite A Friend
  • My Basket
  • Articles
    • All
    • Thematic
    • Tactical
    • Asia
    • EMEA
    • Americas
    • Newsletters
    • Freemium
    • Editor's Choice
    • Most Viewed
    • Most Shared
    • Most Liked
  • Calendar
    • Interactive
      • China
      • United States
      • Eurozone
      • United Kingdom
    • Month Ahead
    • Reviews
    • Previews
  • Forecasts
    • Forecasts
    • Key Views
  • Events
    • Media
    • Conference Calls
  • Data
    • Country Insights
    • Shadow Credit Ratings
    • Full CI Data Download
  • Newsletters
  • My Alerts
  • Community
    • FX
    • Fixed Income
    • Macro Strategy
    • Credit Markets
    • Equities
    • Commodities
    • Precious Metals
    • Renewables
  • Directory
  • My Account
  • Notifications Setup
  • Administration Panel
  • Account Details
  • Recent Devices
  • Distribution Lists
  • Shared Free Trials
  • Saved Articles
  • Shared Alerts
  • My Posts
Published: 2025-12-09T12:47:39.000Z

Chart USD/ZAR Update: Balanced above fresh 2025 year low - studies under pressure

-

Anticipated losses have posted a fresh 2025 year low below 17.000 around 16.9000

 Level Comment  Level Comment
R4 17.5775 5 Nov (w) high S1 17.0000**congestion
R3 17.5000**congestion S2 16.9000*5 Dec YTD low
R2 17.4000*congestion S3 16.6900**January 2023 (y) low
R1 17.2000*congestion S4 16.6500**50% ret of 2021-2023 rally

Asterisk denotes strength of level

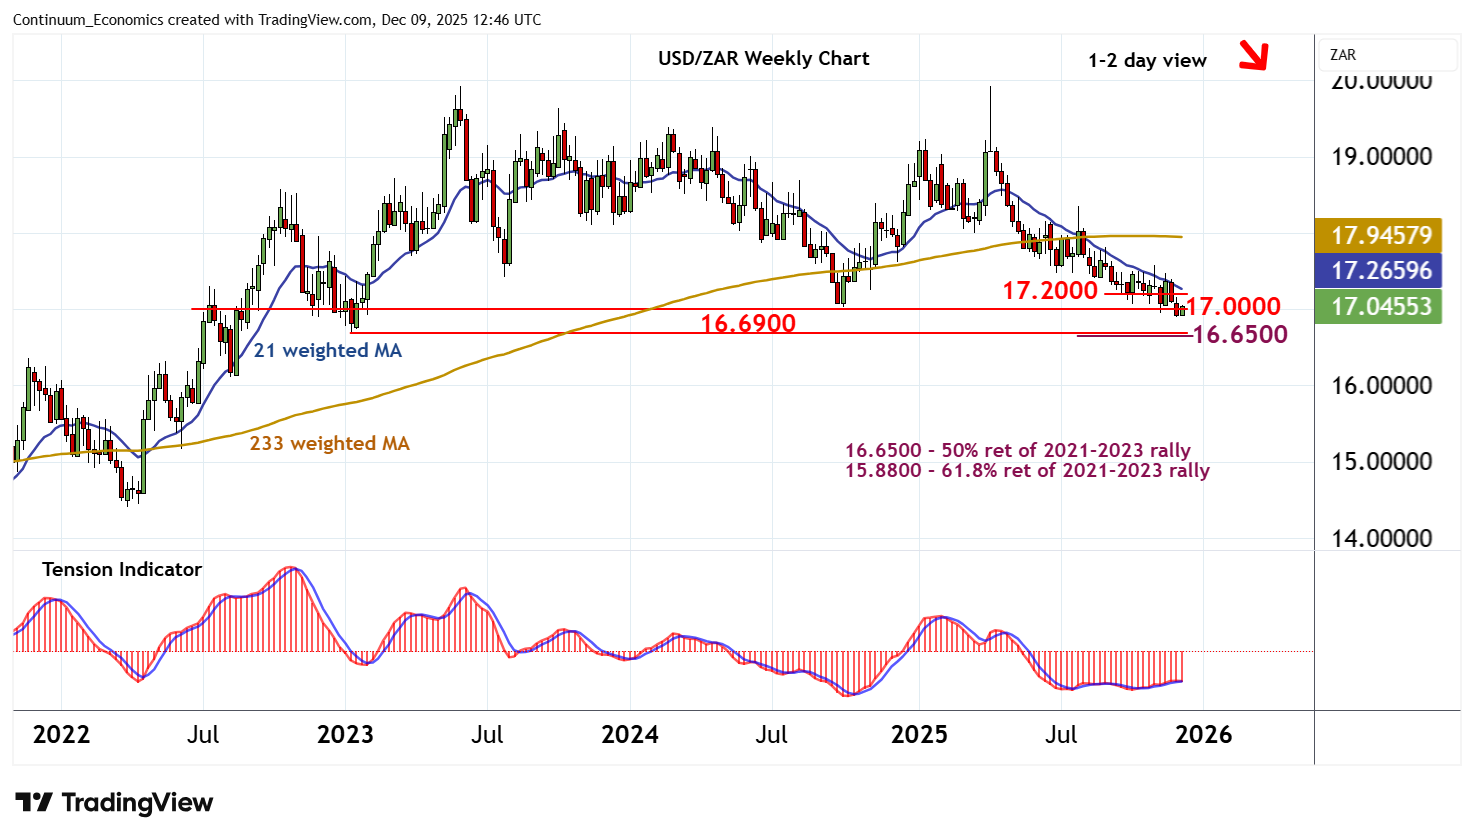
12:20 GMT - Anticipated losses have posted a fresh 2025 year low below 17.000 around 16.9000, before bouncing back into consolidation above 17.0000. Oversold daily stochastics are unwinding and the bearish daily Tension Indicator is flattening, suggesting room for a bounce. But negative weekly and longer-term charts are expected to limit scope in renewed selling interest towards congestion resistance at 17.2000. Following corrective trade, fresh losses are looked for. A close below 16.9000-17.0000 will add weight to sentiment and extend April losses towards the 16.6900 year low of January 2023 and the 16.6500 Fibonacci retracement.

Continue to read the article for free
Login

or

or

Topics
USD/ZAR-TA
Technical Analysis
EEMEA-Technical

GENERAL

  • Home
  • About Us
  • Our Team
  • Careers

LEGAL

  • Terms and Conditions
  • Privacy Policy
  • Compliance
  • GDPR

GET IN TOUCH

  • Contact Us
Continuum Economics
The Technical Analyst Awards Winner 2021
The Technical Analyst Awards Finalist 2020
image