Published: 2026-03-20T01:02:19.000Z
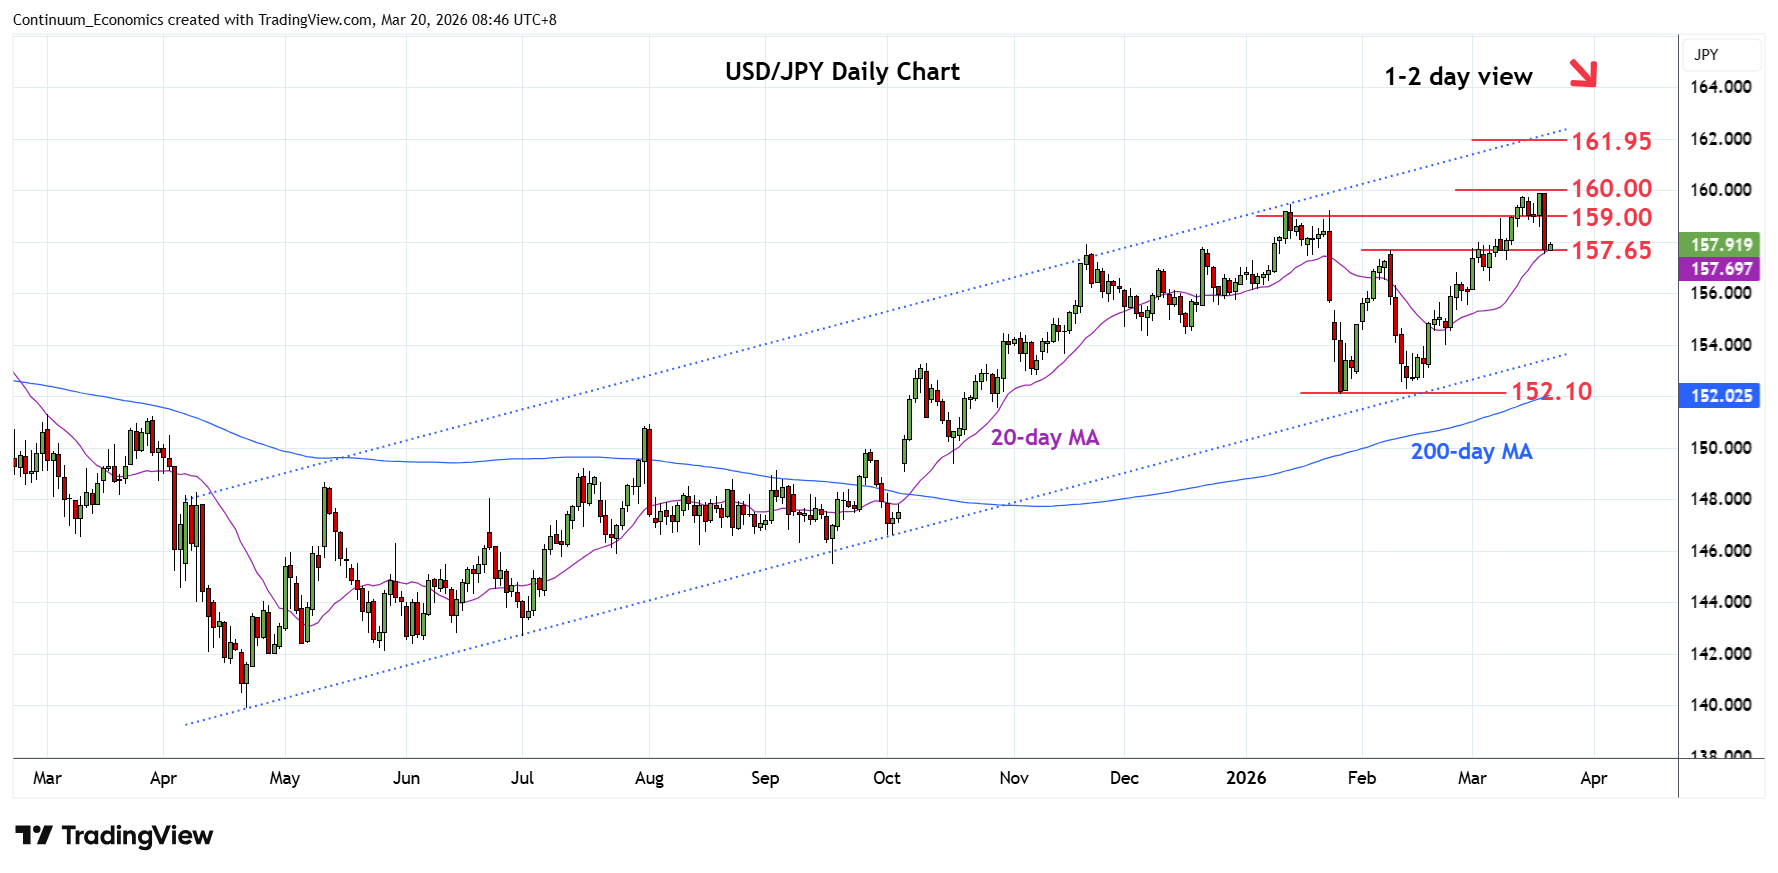
Chart USD/JPY Update: Sharp pullback from 160.00 figure
2
Consolidation beneath the 160.00 figure has given way to sharp pullback as prices unwind the overbought intraday and daily studies
| Levels | Imp | Comment | Levels | Imp | Comment | |||
|---|---|---|---|---|---|---|---|---|
| R4 | 161.00 | * | congestion | S1 | 157.50 | * | 9 Feb high, congestion | |
| R3 | 159.90 | ** | 18 Mar YTD high | S2 | 157.00 | * | congestion | |
| R2 | 159.45 | * | Jan high | S3 | 156.45 | * | 5 Mar low | |
| R1 | 159.00 | * | congestion | S4 | 156.00 | * | congestion |
Asterisk denotes strength of level
01:00 GMT - Consolidation beneath the 160.00 figure has given way to sharp pullback as prices unwind the overbought intraday and daily studies. break of the 157.65 support has since steadied at the 157.50 congestion but risk is seen for deeper pullback to retrace strong gains from the 152.27, February low. Lower will see room to 157.00 congestion then the 156.45/00 area. Meanwhile, resistance is lowered to the 159.00 level which is expected to cap and keep pressure on the downside. Regaining this will expose the 159.45 and 159.90 highs to retest.