Published: 2026-03-02T00:22:09.000Z
Chart AUD/USD Update: Lower in consolidation
2
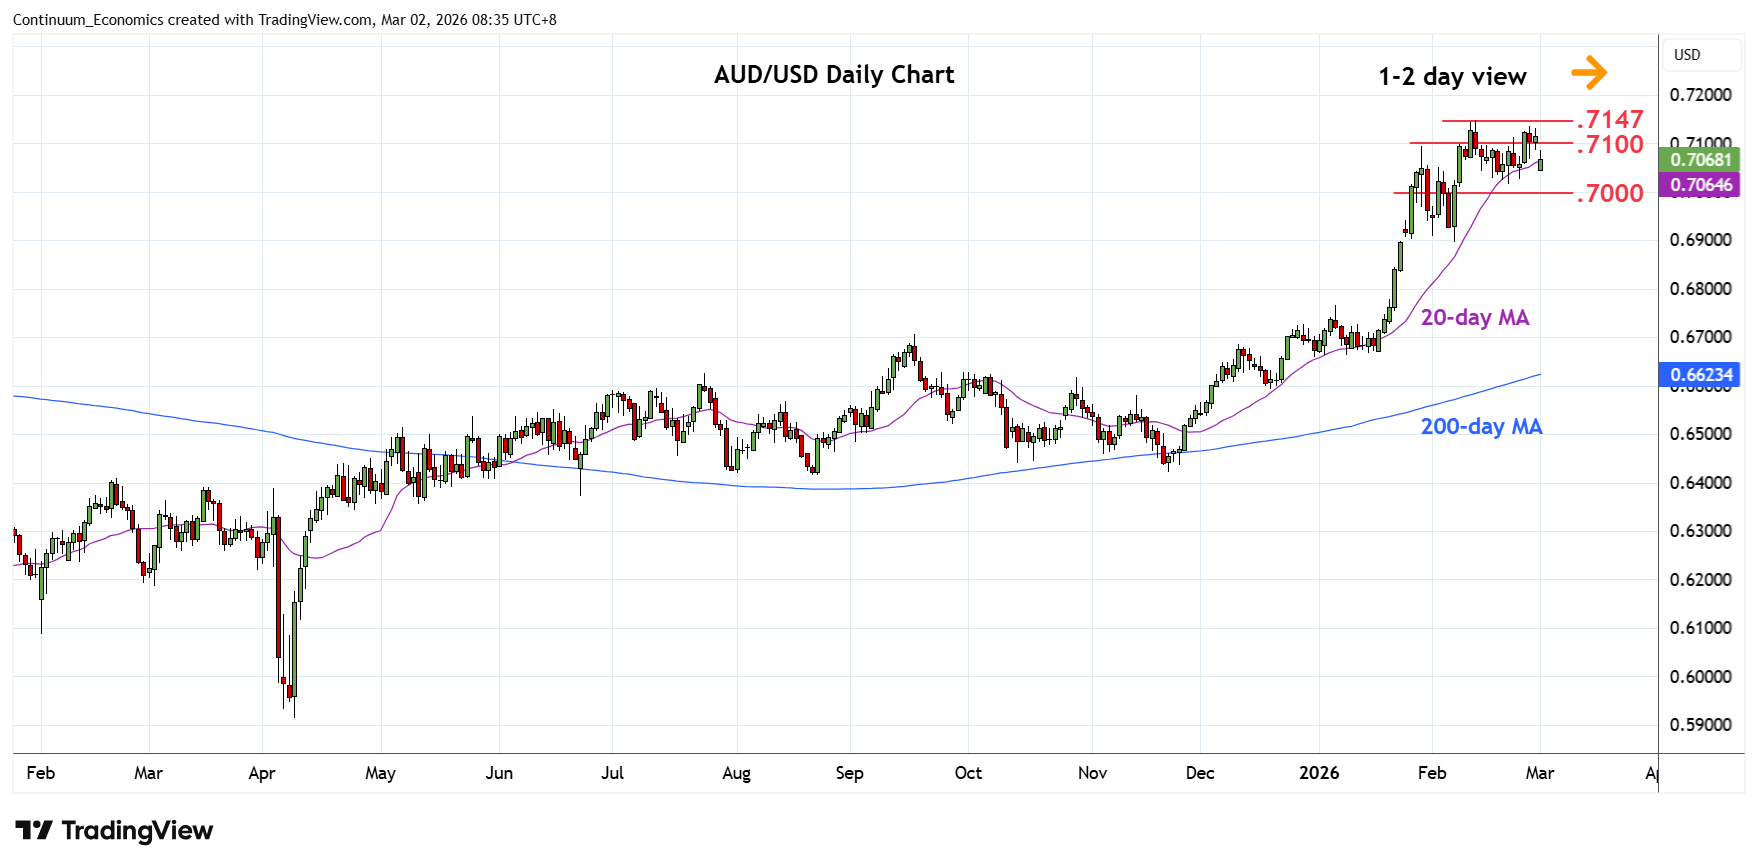
Lower at the open as prices gives way to selling pressure beneath the .7147 current year high
| Levels | Imp | Comment | Levels | Imp | Comment | |||
|---|---|---|---|---|---|---|---|---|
| R4 | 0.7280 | * | Jun 2022 high | S1 | 0.7015/00 | * | 20 Feb low, congestion | |
| R3 | 0.7205 | * | 61.8% 2021/2025 fall | S2 | 0.6950 | * | congestion | |
| R2 | 0.7147 | ** | 12 Feb YTD high | S3 | 0.6900 | ** | congestion, 6 Feb low | |
| R1 | 0.7100 | * | congestion | S4 | 0.6870 | * | 38.2% Nov/Feb rally |
Asterisk denotes strength of level
00:15 GMT - Lower at the open as prices gives way to selling pressure beneath the .7147 current year high. Pullback see room for retest of the .7015 support and break here and the .7000 level will open up room for deeper pullback to retrace recent bounce from strong support at the .6900 level. Meanwhile, resistance at the .7100 congestion and extending to the .7147 high is expected to cap. Would take break here to extend the bull trend from the April low.