Published: 2026-03-27T08:56:10.000Z
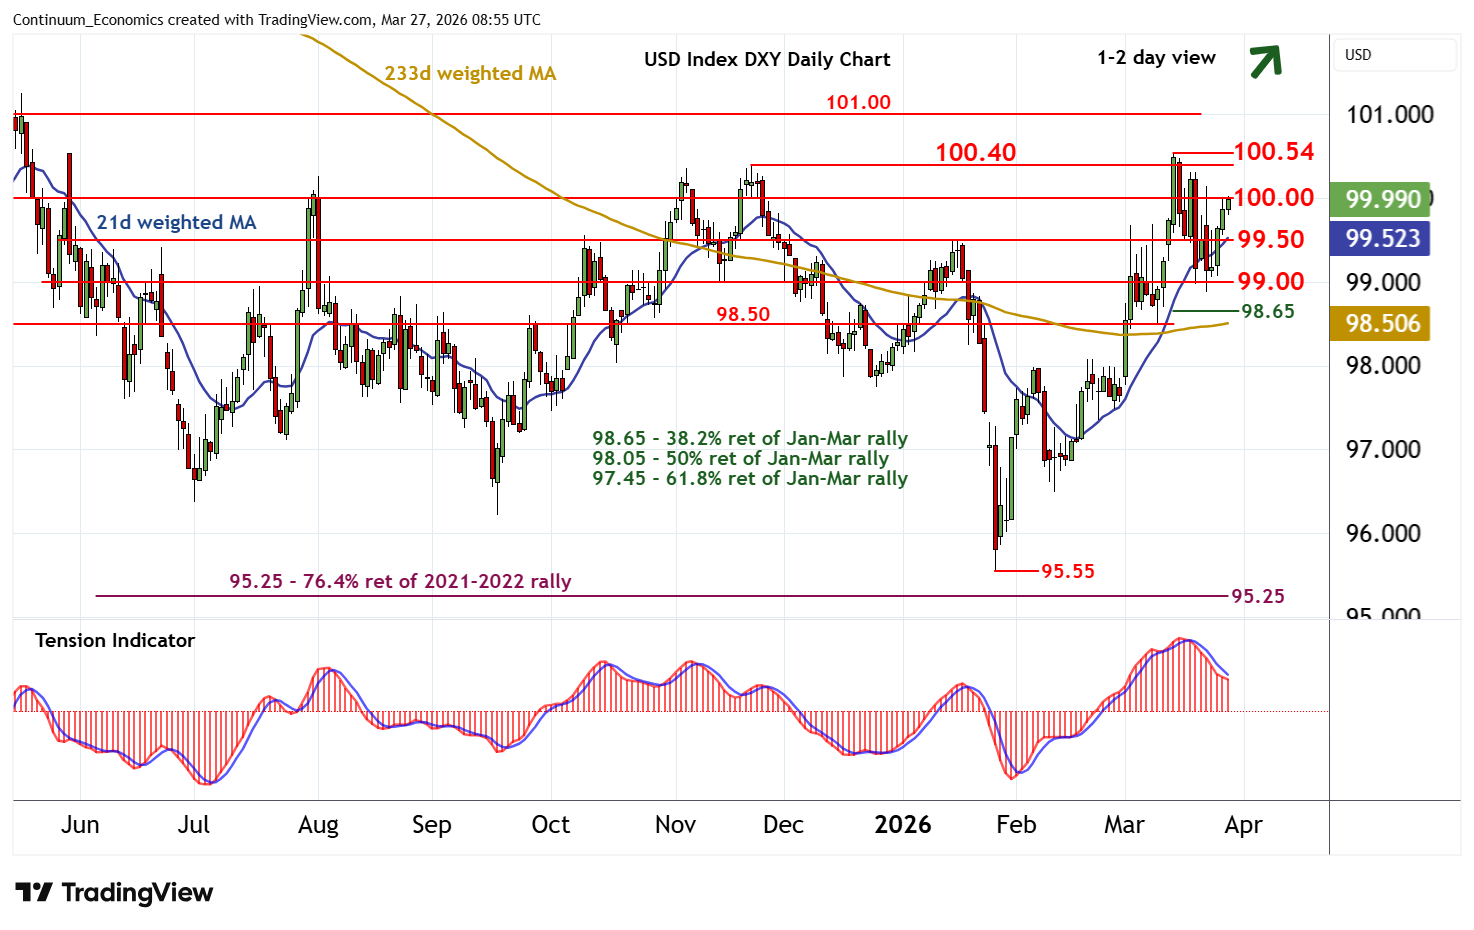
Chart USD Index DXY Update: Strong resistance at 100.40/54
2
Little change, as prices extend pressure on congestion resistance at 100.00
| Levels | Imp | Comment | Levels | Imp | Comment | |||
|---|---|---|---|---|---|---|---|---|
| R4 | 101.15 | ** | 38.2% ret of 2025-2026 fall | S1 | 99.50 | * | congestion | |
| R3 | 101.00 | * | congestion | S2 | 99.00 | ** | congestion | |
| R2 | 100.40/54 | ** | 21 Nov (m); 13 Mar YTD highs | S3 | 98.65 | * | 38.2% ret of Jan-Mar rally | |
| R1 | 100.00 | ** | congestion | S4 | 98.50 | * | congestion |
Asterisk denotes strength of level
08:40 GMT - Little change, as prices extend pressure on congestion resistance at 100.00. Oversold daily stochastics are unwinding, highlighting room for a test above here. But the negative daily Tension Indicator and mixed weekly charts should limit initial scope in renewed consolidation beneath critical resistance at 100.40/54. Meanwhile, support remains at congestion around 99.50. A close back beneath here, if seen, would help to stabilise price action and prompt consolidation above congestion around 99.00.