Published: 2026-01-13T14:37:30.000Z
Chart EUR/JPY Update: At 35-year highs in JPY-driven trade
-
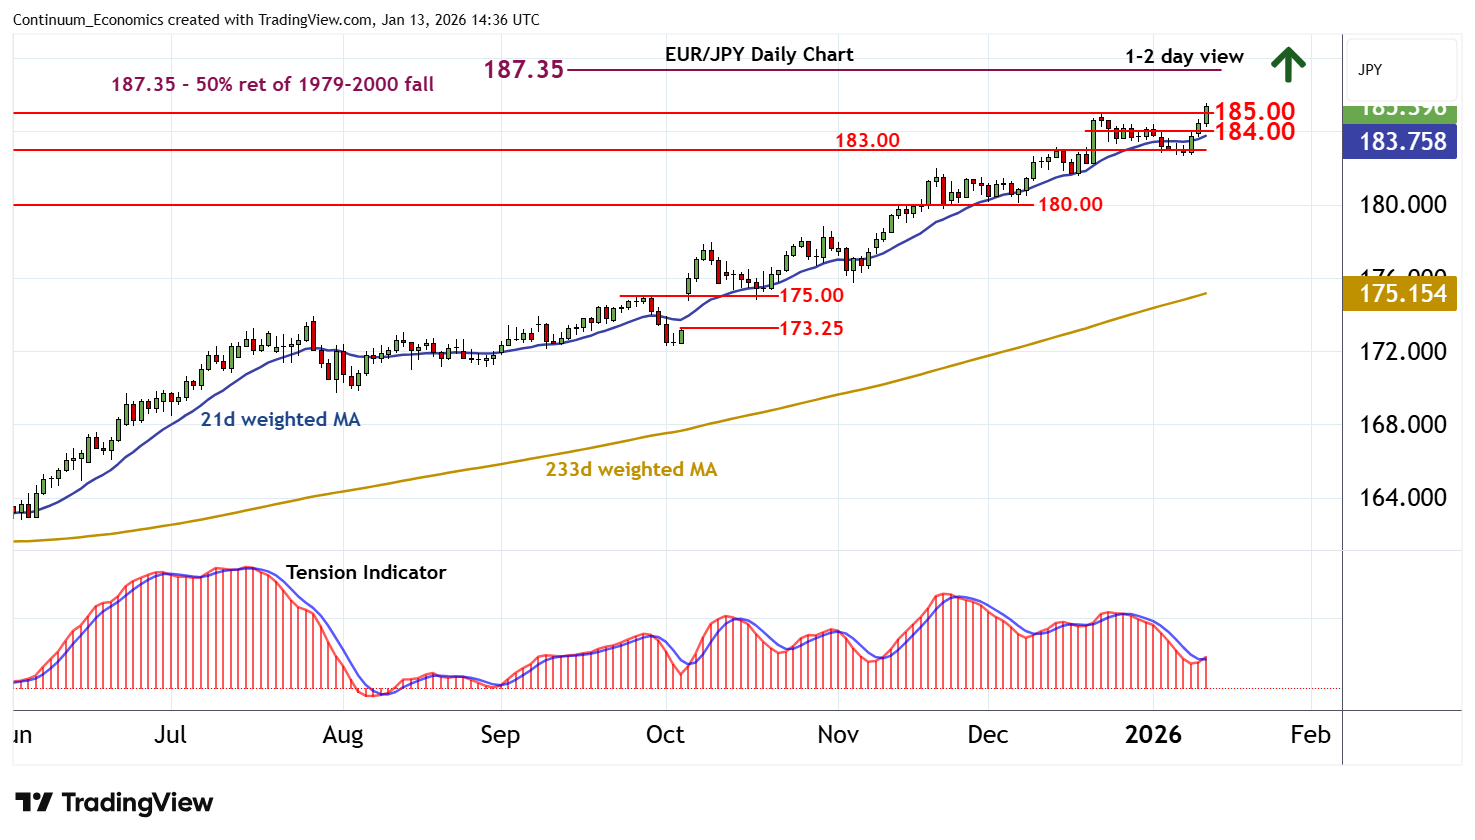
Anticipated tests higher are extending in JPY-driven trade, with prices currently trading at multi-decade highs around 185.35
| Levels | Imp | Comment | Levels | Imp | Comment | |||
|---|---|---|---|---|---|---|---|---|
| R4 | 190.00 | * | historic congestion | S1 | 185.00 | * | break level | |
| R3 | 188.20~ | ** | May 1990 (y) high | S2 | 184.00 | * | congestion | |
| R2 | 187.35 | ** | 50% ret of 1979-2000 fall | S3 | 183.00 | * | break level | |
| R1 | 186.00 | * | figure | S4 | 182.00 | * | break level |
Asterisk denotes strength of level
14:25 GMT - Anticipated tests higher are extending in JPY-driven trade, with prices currently trading at multi-decade highs around 185.35. Daily readings are improving, highlighting room for continuation of long-term gains. But mixed/negative weekly charts could prompt profit-taking/consolidation towards strong resistance at the 187.35 multi-decade Fibonacci retracement. Meanwhile, support is raised to 185.00. A close beneath here would turn sentiment neutral and prompt consolidation around congestion support at 184.00.