Published: 2025-02-21T01:11:18.000Z
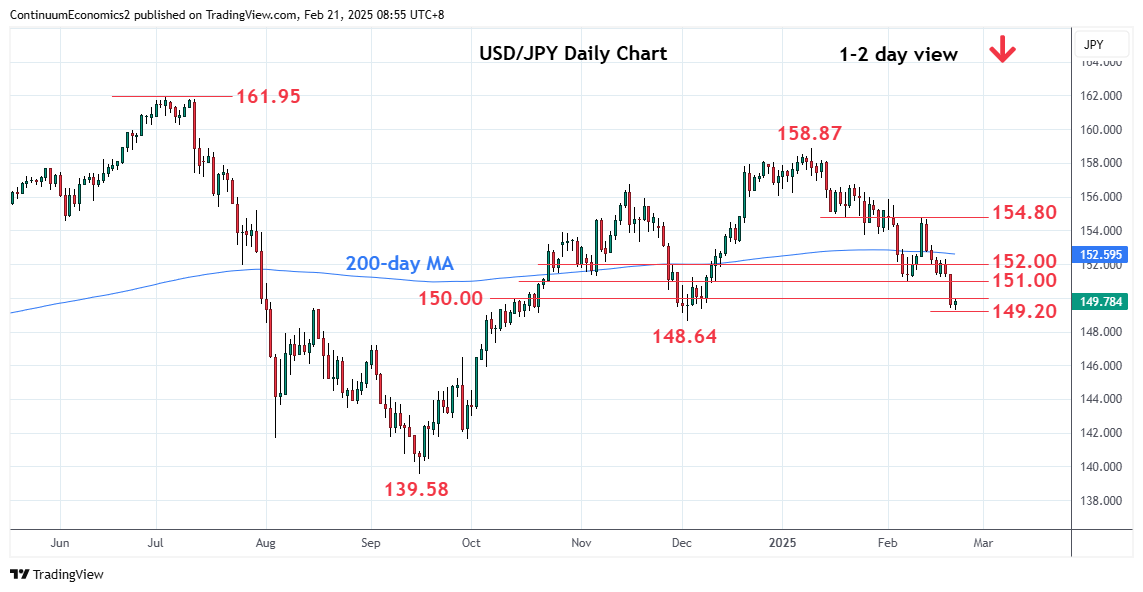
Chart USD/JPY Update: Focus turn to 148.64, December low

Technical Analyst
1
Break of the 151.00 support saw sharp losses through the 150.00 level before settling into consolidation at the 149.20, 50% Fibonacci level
| Levels | Imp | Comment | Levels | Imp | Comment | |||
|---|---|---|---|---|---|---|---|---|
| R4 | 152.60 | * | 200-day MA | S1 | 149.20 | * | 50% Sep/Jan rally | |
| R3 | 152.00 | * | congestion | S2 | 148.64 | ** | Dec low | |
| R2 | 150.93/00 | * | 7 Feb low | S3 | 148.00 | * | congestion | |
| R1 | 150.40 | * | intraday level | S4 | 146.95 | * | 61.8% Sep/Jan rally |
Asterisk denotes strength of level
01:00 GMT - Break of the 151.00 support saw sharp losses through the 150.00 level before settling into consolidation at the 149.20, 50% Fibonacci level to unwind the oversold intraday studies. However, bearish structure from the January high suggest consolidation giving way to further losses later to retest the December low at 148.64 then the 148.00 congestion. Meanwhile, resistance is lowered to the 150.40 intraday level and this extend to the 151.00 previous low which should now cap corrective bounce and sustain the bearish pressure.