Published: 2026-03-12T01:58:14.000Z
Chart GBP/USD Update: Consolidating, but bearish bias weighs
1
Settled back to consolidate at the 1.3400 level after bounce attempt failed to get a foothold above the 200-day MA
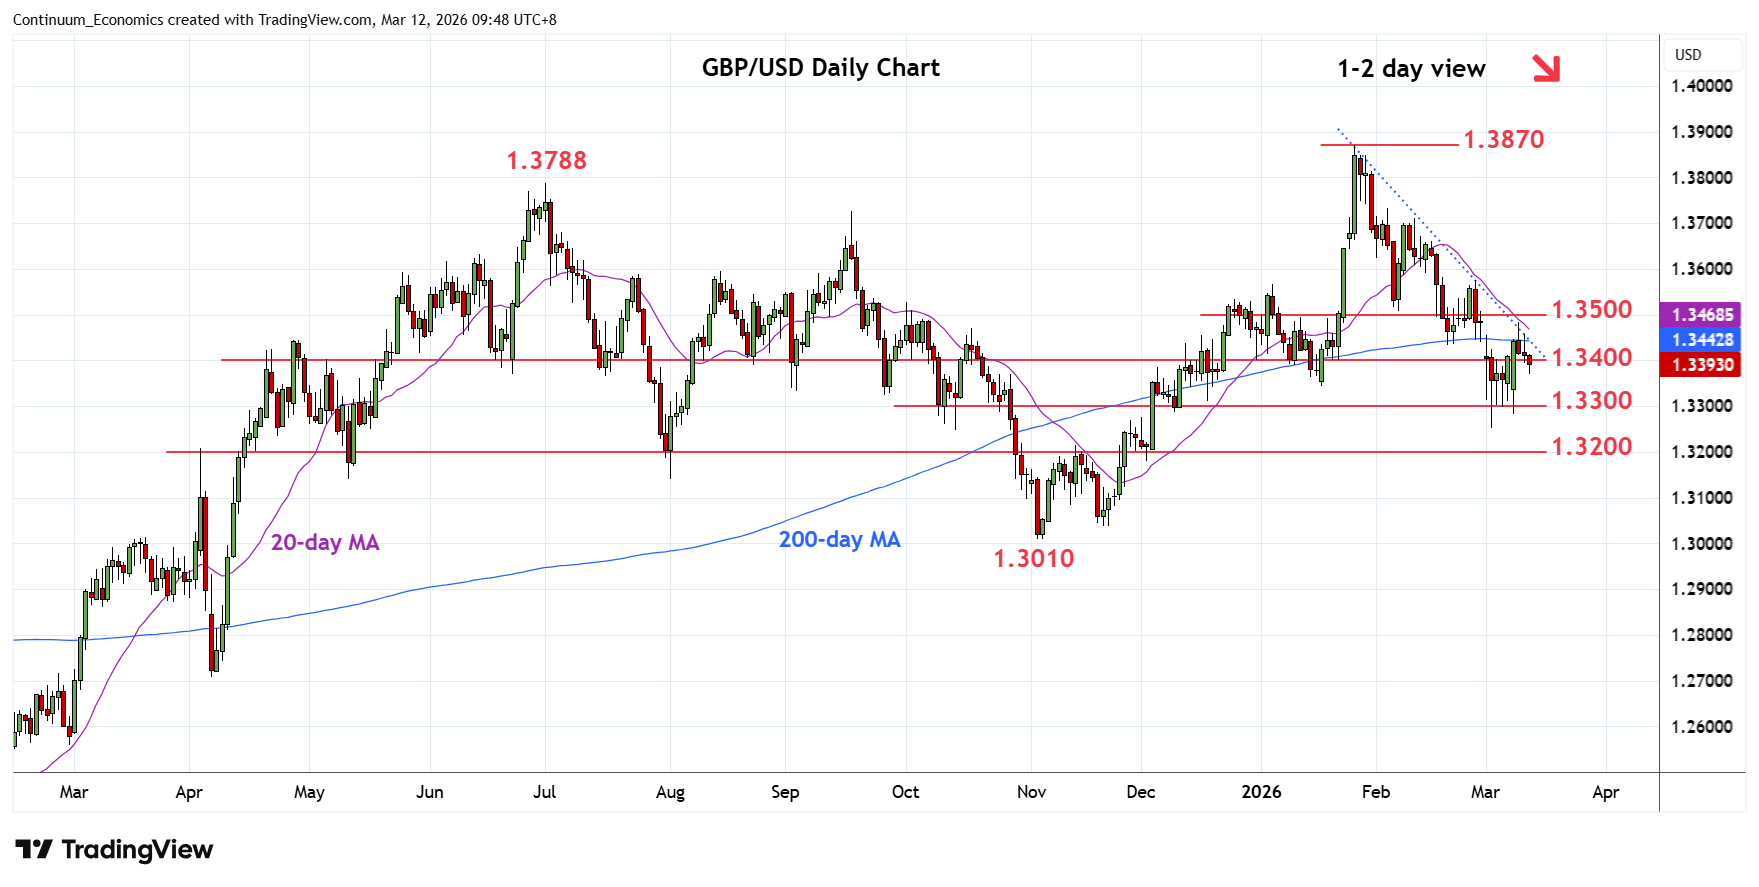
| Level | Comment | Level | Comment | |||||
|---|---|---|---|---|---|---|---|---|
| R4 | 1.3600 | * | congestion | S1 | 1.3344 | * | Jan low | |
| R3 | 1.3575 | ** | 26 Feb high | S2 | 1.3300 | * | congestion | |
| R2 | 1.3500/10 | ** | congestion, 6 Feb low | S3 | 1.3253 | ** | 3 Mar YTD low | |
| R1 | 1.3485 | * | 10 Mar high | S4 | 1.3215 | * | 76.4% Nov/Jan rally |
Asterisk denotes strength of level
01:50 GMT - Settled back to consolidate at the 1.3400 level after bounce attempt failed to get a foothold above the 200-day MA. Rejection from the 1.3485 see successive lower highs from the 1.3870 January current year high weighing and threaten retest of support at the 1.3300 congestion and the 3 March YTD low at 1.3253. Below this will see deeper pullback to retrace the November/January rally to 1.3215, 76.4% Fibonacci level. Meanwhile, resistance at the 1.3450/1.3485 congestion and Tuesday's high now expected to cap and sustain bearish bias from January high.