Published: 2025-04-17T12:55:26.000Z
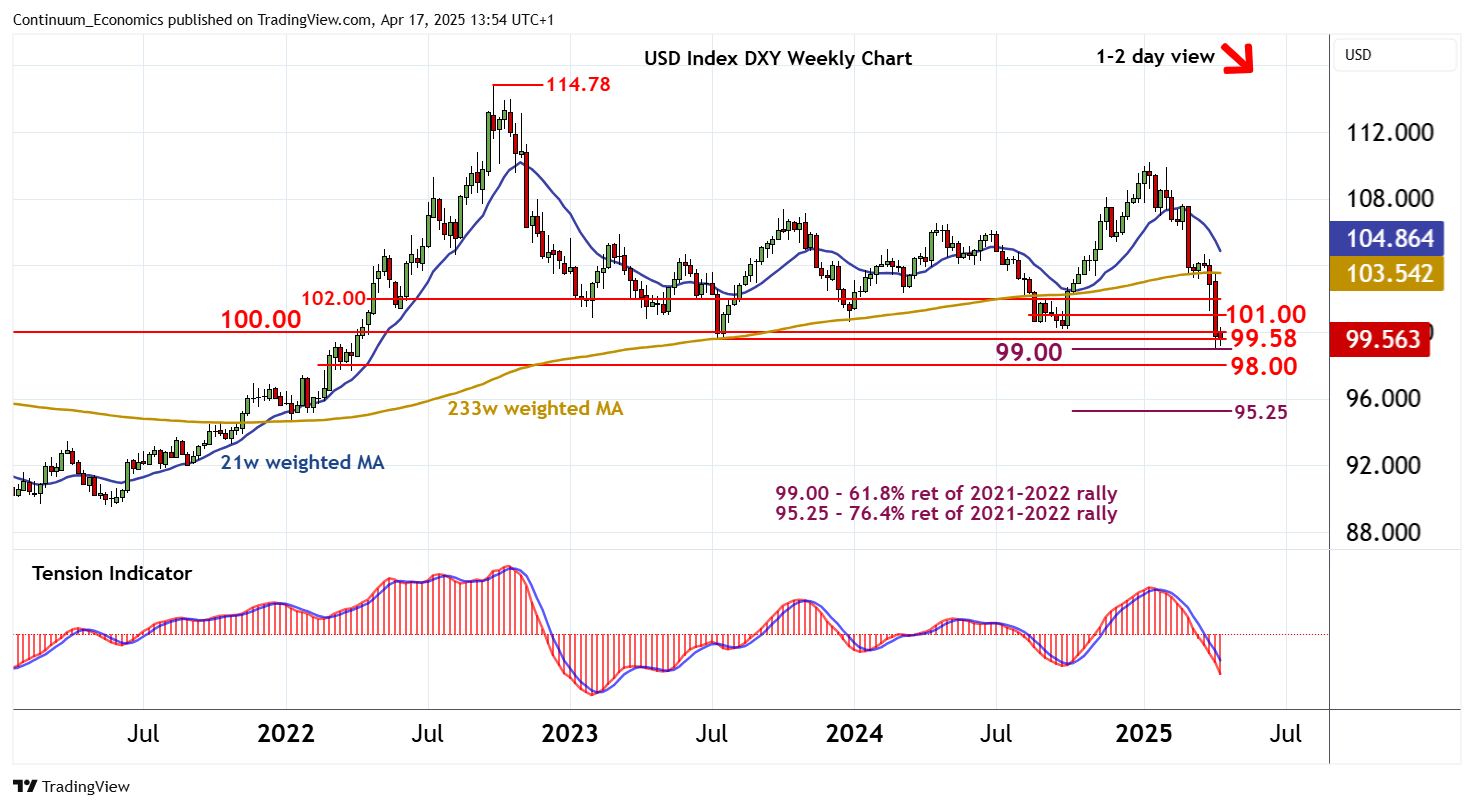
Chart USD Index DXY Update: Extending consolidation - studies under pressure

Senior Technical Strategist
1
Still little change, as prices extend cautious trade
| Levels | Imp | Comment | Levels | Imp | Comment | |||
|---|---|---|---|---|---|---|---|---|
| R4 | 103.00 | congestion | S1 | 99.58 | ** | July 2023 (y) low | ||
| R3 | 102.00 | ** | break level | S2 | 99.00 | ** | 61.8% ret of 2021-2022 rally | |
| R2 | 101.00 | * | break level | S3 | 98.00 | * | congestion | |
| R1 | 100.00 | ** | congestion | S4 | 96.00 | ** | congestion |
Asterisk denotes strength of level
13:40 BST - Still little change, as prices extend cautious trade following the test below the 99.58 year low of July 2023. Rising intraday studies and a tick higher in oversold daily stochastics highlight room for a test above congestion resistance at 100.00. But the negative daily Tension Indicator and bearish weekly charts are expected to limit scope in renewed selling interest beneath resistance at 101.00. Following cautious trade, fresh losses are looked for. A close below support at the 99.00 Fibonacci retracement will confirm completion of a multi-month distribution top, with focus then turning initially to congestion around 98.00.