Published: 2026-04-08T01:19:08.000Z
Chart USD/JPY Update: Sharp pullback from 160.00 figure
2
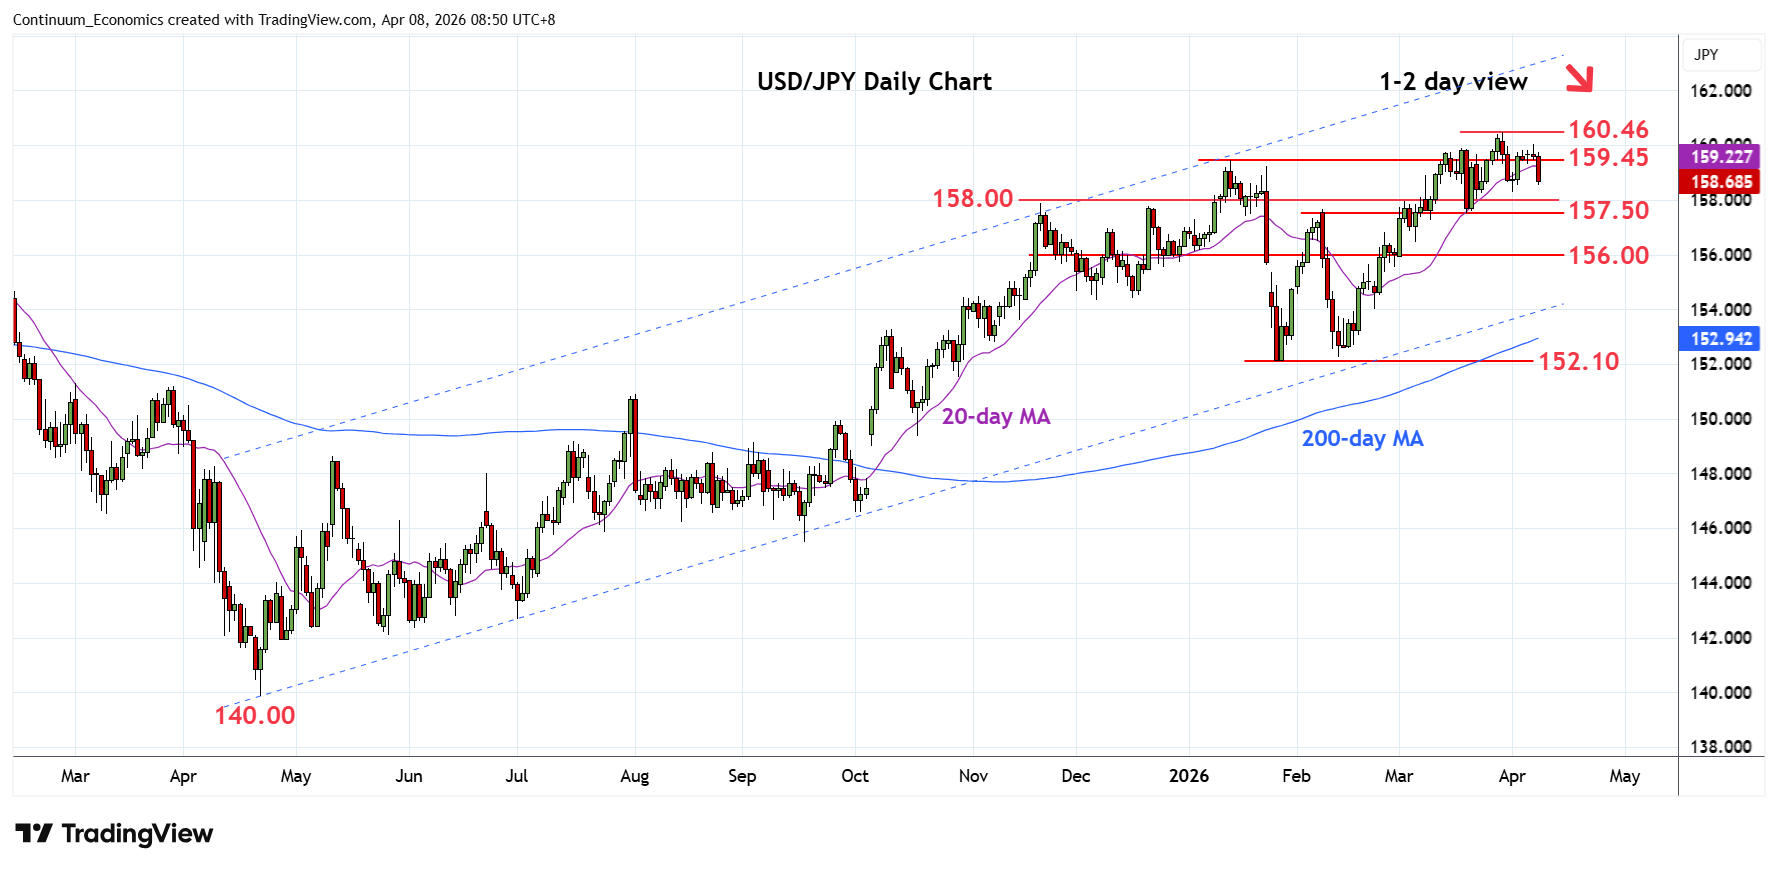
Drift higher to tag the 160.00 figure has given way to sharp selling pressure through support the 159.45/159.00 area
| Levels | Imp | Comment | Levels | Imp | Comment | |||
|---|---|---|---|---|---|---|---|---|
| R4 | 160.46 | ** | 30 Mar YTD high | S1 | 158.27/00 | ** | 1 Apr low, congestion | |
| R3 | 160.00 | * | congestion | S2 | 157.50 | ** | 19 Mar low | |
| R2 | 159.45 | * | Jan high | S3 | 157.25 | * | 38.2% Jan/Mar rally | |
| R1 | 159.00 | congestion | S4 | 156.50 | * | congestion |
Asterisk denotes strength of level
01:10 GMT - Drift higher to tag the 160.00 figure has given way to sharp selling pressure through support the 159.45/159.00 area. Daily and weekly studies have turned down to unwind overbought readings and break here opens up room for retest of support at the 158.27/00 area. Below this will open up room for deeper pullback to retrace gains from the 152.10 January current year low to the 157.50/157.25 area. Meanwhile, resistance is lowered to the 159.00/159.45 congestion and January high which is now expected to cap.