Published: 2024-11-27T14:02:01.000Z
Chart USD Index DXY Update: Under pressure

Senior Technical Strategist
-

Choppy trade has given way to anticipated losses

| Levels | Imp | Comment | Levels | Imp | Comment | |||
|---|---|---|---|---|---|---|---|---|
| R4 | 109.00 | ** | 61.8% ret of 2022-2023 fall | S1 | 106.00 | * | break level | |
| R3 | 108.00/07 | * | figure; 22 Nov YTD high | S2 | 105.50 | * | congestion | |
| R2 | 107.50 | intraday break level | S3 | 105.00 | ** | congestion | ||
| R1 | 106.50 | ** | congestion | S4 | 104.64 | ** | 29 Oct (m) high |
Asterisk denotes strength of level
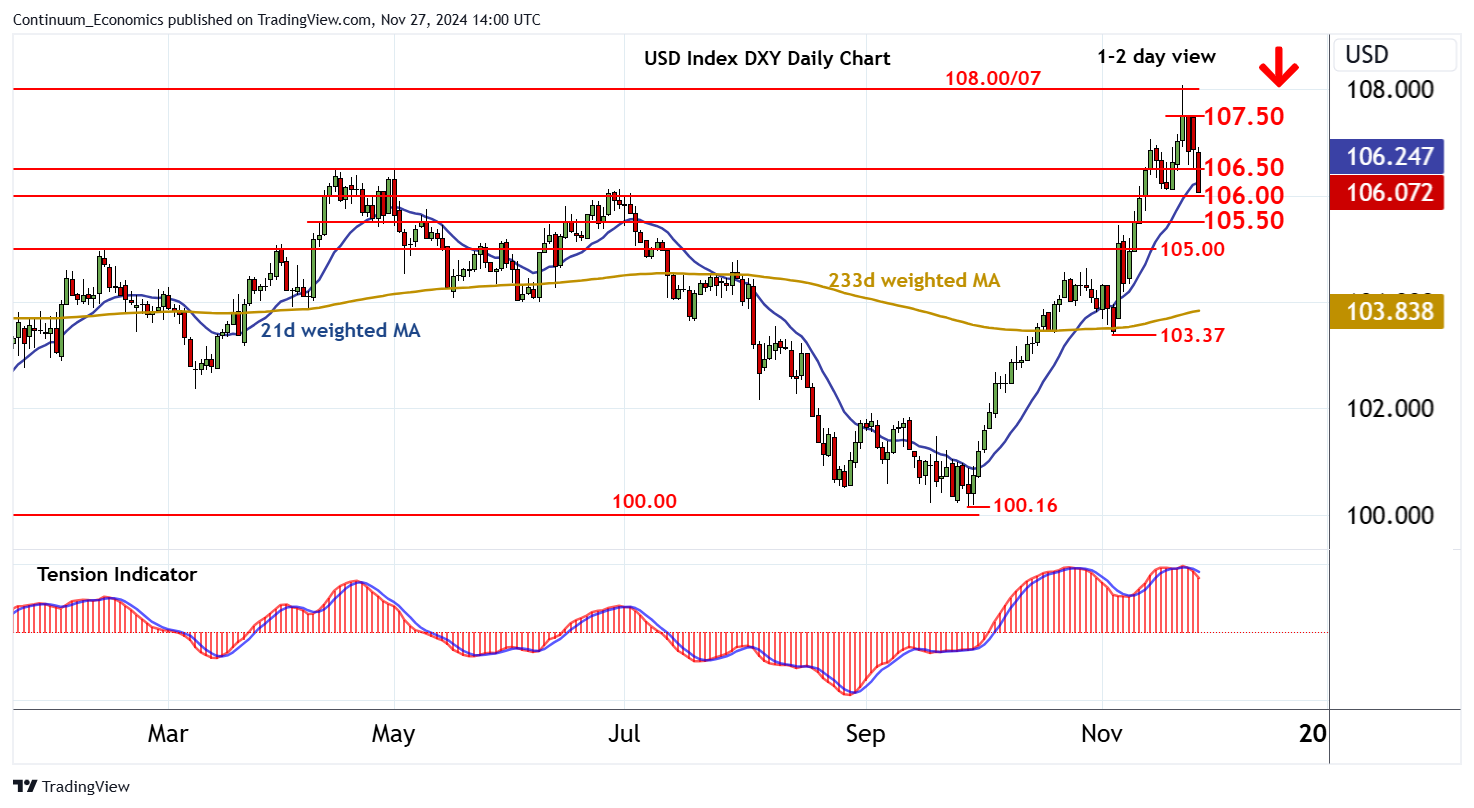
13:50 GMT - Choppy trade has given way to anticipated losses, with the break below 106.50 approaching support at 106.00. Daily stochastics are under pressure, unwinding negative divergence, and the daily Tension Indicator is also falling, highlighting a bearish tone and room for a break beneath here towards congestion around 105.50. Overbought weekly stochastics are also turning down, suggesting potential for still deeper losses. Meanwhile, a close back above congestion resistance at 106.50, if seen, would turn sentiment neutral and prompt consolidation beneath 107.50.