Published: 2025-02-20T12:48:43.000Z
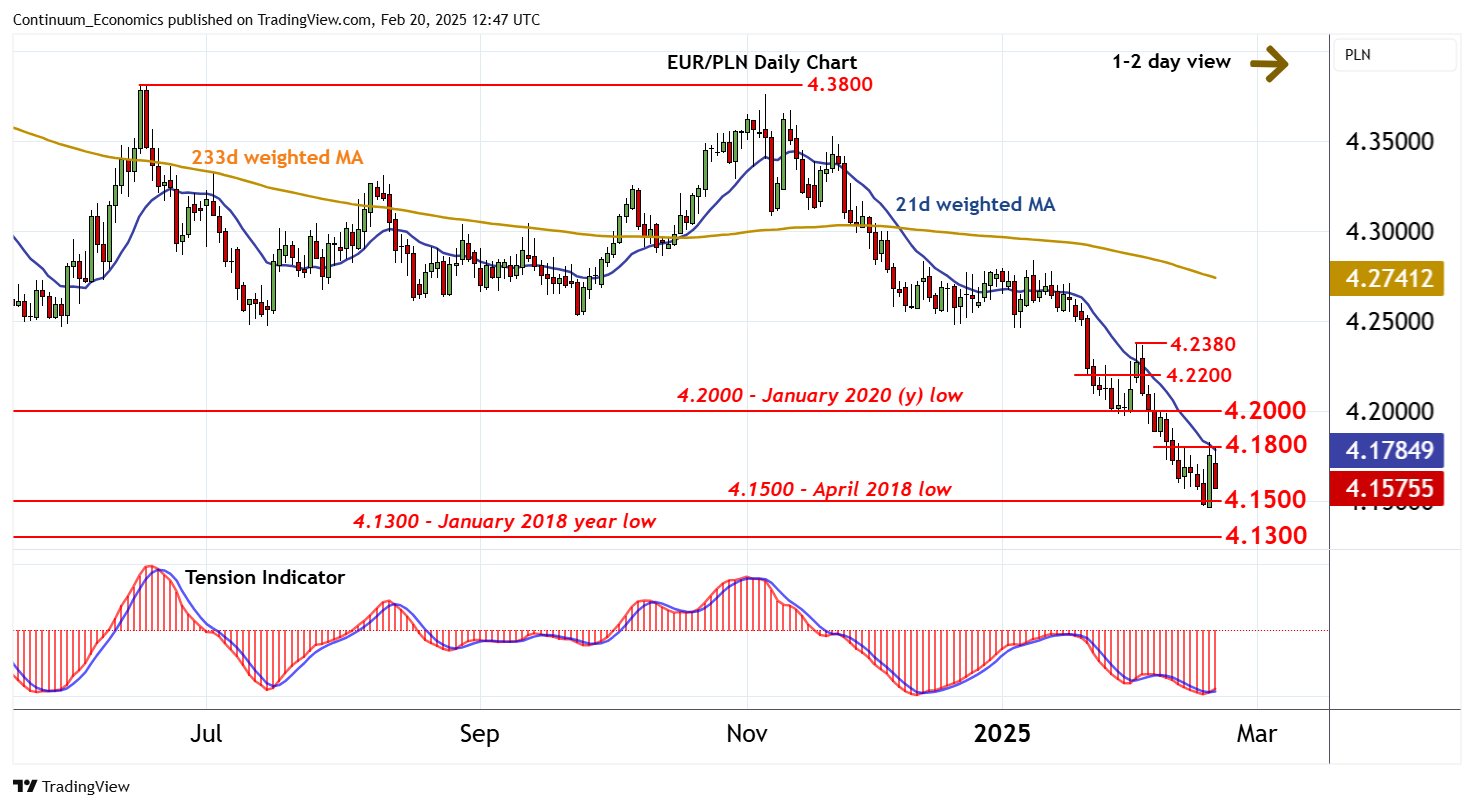
Chart EUR/PLN Update: Choppy above April 2018 low

Senior Technical Strategist
-
The test of resistance at the 4.1800 break level is giving way to a pullback
| Levels | Imp | Comment | Levels | Imp | Comment | |||
| R4 | 4.2380 | ** | 3 Feb (w) high | S1 | 4.1500 | * | April 2018 low | |
| R3 | 4.2200 | * | break level | S2 | 4.1300 | ** | January 2018 (y) low | |
| R2 | 4.2000 | ** | January 2020 (y) low, figure | S3 | 4.1000 | ** | 76.4% ret of 2010-2022 rally | |
| R1 | 4.1800 | break level | S4 | 4.0150 | * | May 2015 low |
Asterisk denotes strength of level
12:25 GMT - The test of resistance at the 4.1800 break level is giving way to a pullback, as overbought intraday studies unwind, with focus turning back to strong support at the 4.1500 low of April 2018. A test beneath here cannot be ruled out, but rising daily readings and flat oversold weekly stochastics are expected to limit scope in short-covering/consolidation towards the 4.1300 year low of January 2018. Meanwhile, a close above 4.1800 would help to improve price action and prompt a run towards 4.2000.