Published: 2025-09-01T15:53:43.000Z
Chart USD/CAD Update: Limited tests higher
0
-
The anticipated test of congestion support at 1.3700 has not been seen
| Levels | Imp | Comment | Levels | Imp | Comment | |||
|---|---|---|---|---|---|---|---|---|
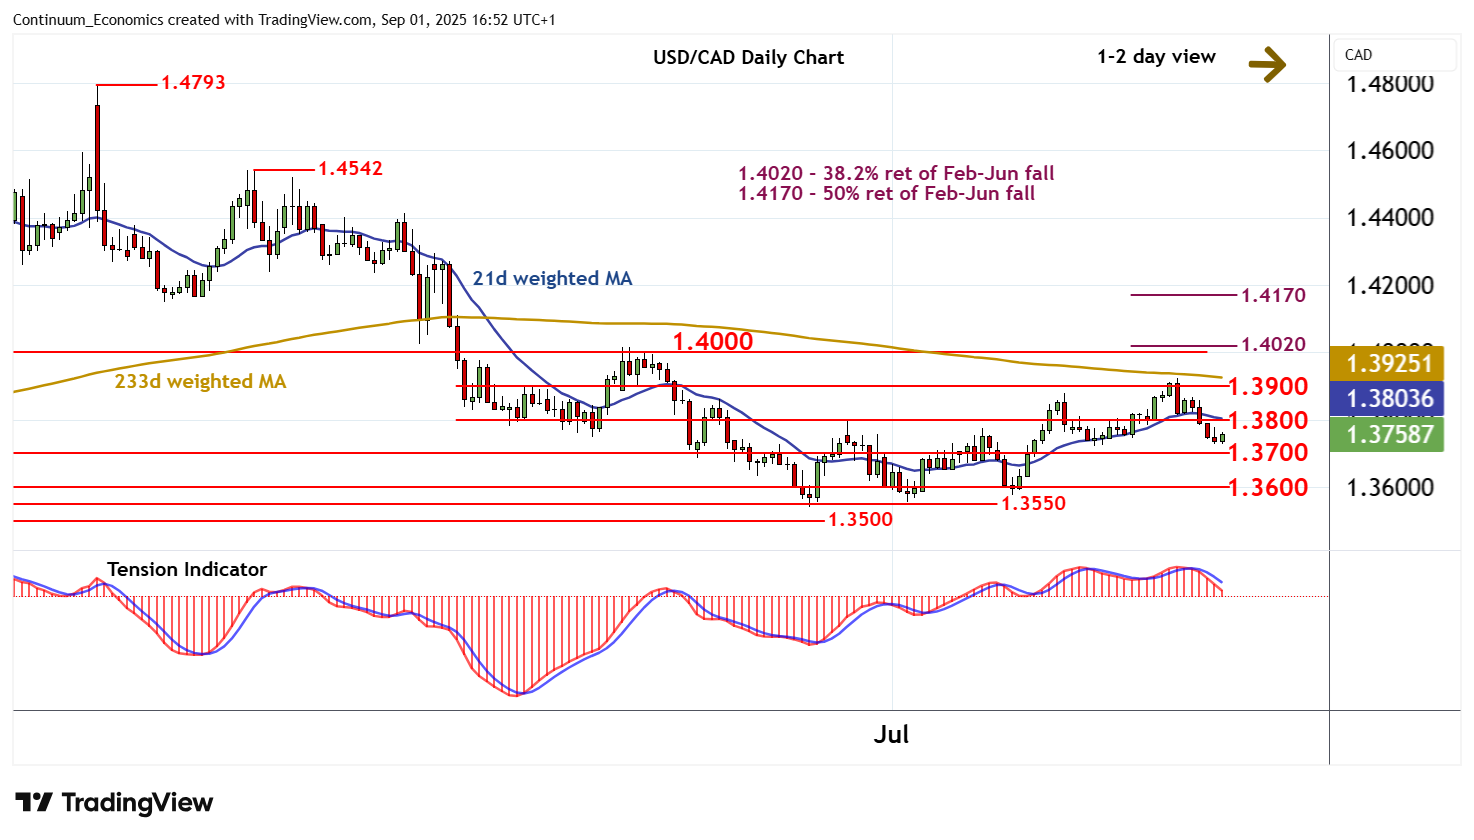
| R4 | 1.4170 | ** | 50% ret of Feb-Jun fall | S1 | 1.3700 | ** | congestion | |
| R3 | 1.4000/20 | ** | break level; 38.2% ret | S2 | 1.3600 | ** | congestion | |
| R2 | 1.3900 | ** | break level | S3 | 1.3550 | * | congestion | |
| R1 | 1.3800 | * | congestion | S4 | 1.3500 | ** | congestion |
Asterisk denotes strength of level
16:30 BST - The anticipated test of congestion support at 1.3700 has not been seen, as rising intraday studies and a tick higher in oversold daily stochastics prompt a bounce and push prices to 1.3760. Resistance is up to congestion around 1.3800. But the bearish daily Tension Indicator and unwinding overbought weekly stochastics are expected to limit any tests in renewed selling interest. Meanwhile, support remains at 1.3700. A close beneath here would add weight to sentiment and open up further congestion around 1.3600. Already oversold daily stochastics could limit any initial tests in consolidation.