Published: 2025-01-21T08:37:38.000Z
Chart EUR/USD Update: Back in range - limited downside tests

Senior Technical Strategist
1

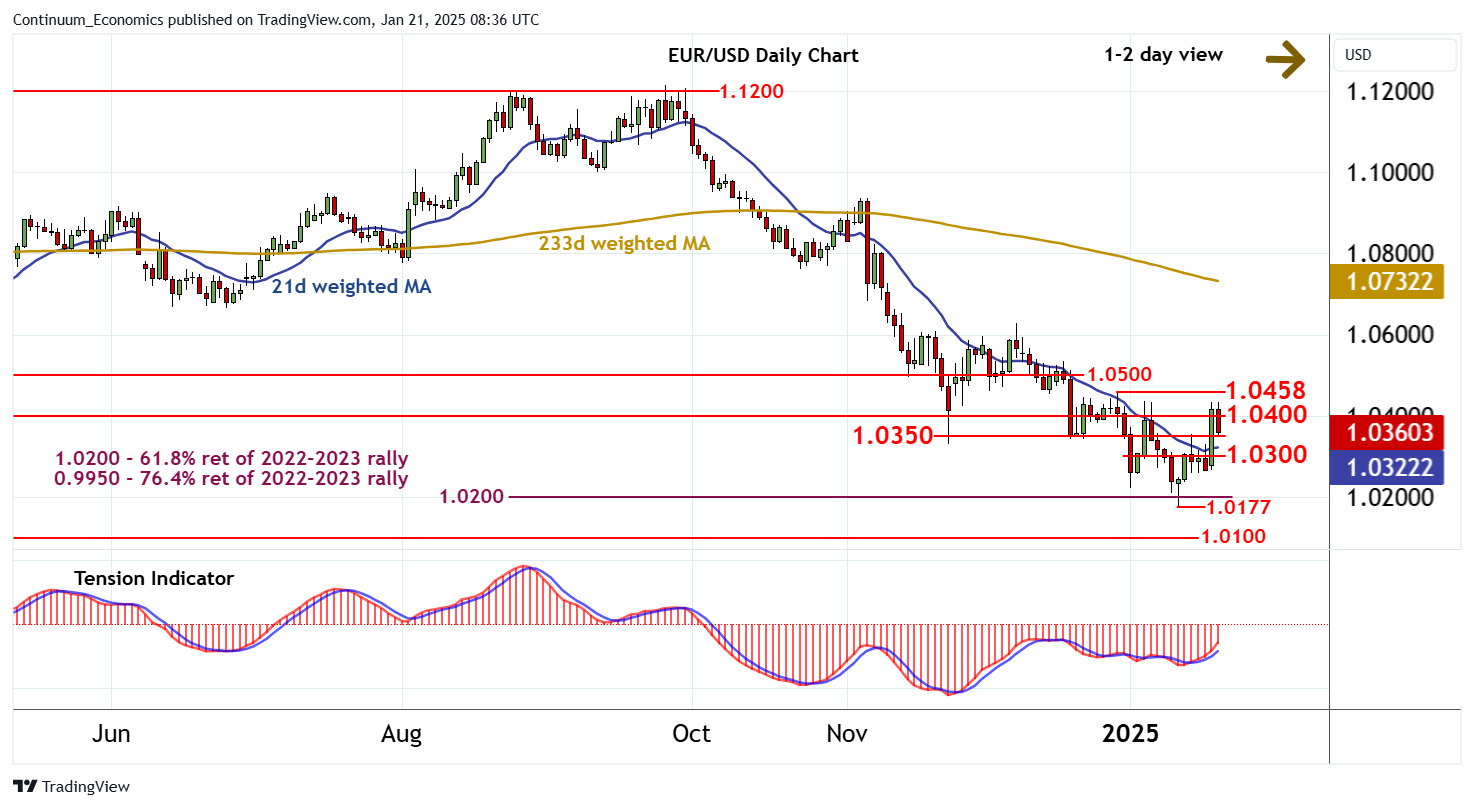
The test of resistance at the 1.0436 weekly high of 6 January is giving way to the anticipated pullback

| Levels | Imp | Comment | Levels | Imp | Comment | |||
|---|---|---|---|---|---|---|---|---|
| R4 | 1.0500 | * | break level | S1 | 1.0350 | break level | ||
| 14 | 1.0458 | ** | 30 Dec (w) high | S2 | 1.0300 | minor congestion | ||
| R2 | 1.0436 | * | 6 Jan (w) high | S3 | 1.0260 | 15 Jan low | ||
| R1 | 1.0400 | ** | congestion | S4 | 1.0200 | ** | 61.8% ret of 2022-2023 rally |
Asterisk denotes strength of level
08:30 GMT - The test of resistance at the 1.0436 weekly high of 6 January is giving way to the anticipated pullback, as overbought intraday studies unwind, with prices once again trading below congestion around 1.0400. A test below support at 1.0350 cannot be ruled out. But rising daily readings and a tick higher in oversold weekly stochastics highlight potential for renewed buying interest/consolidation towards congestion around 1.0300. Following cautious trade, higher levels are looked for. A break back above 1.0400 will improve sentiment. But a further close above the 1.0458 weekly high of 30 December is needed to turn sentiment positive and confirm a more sustainable rally.