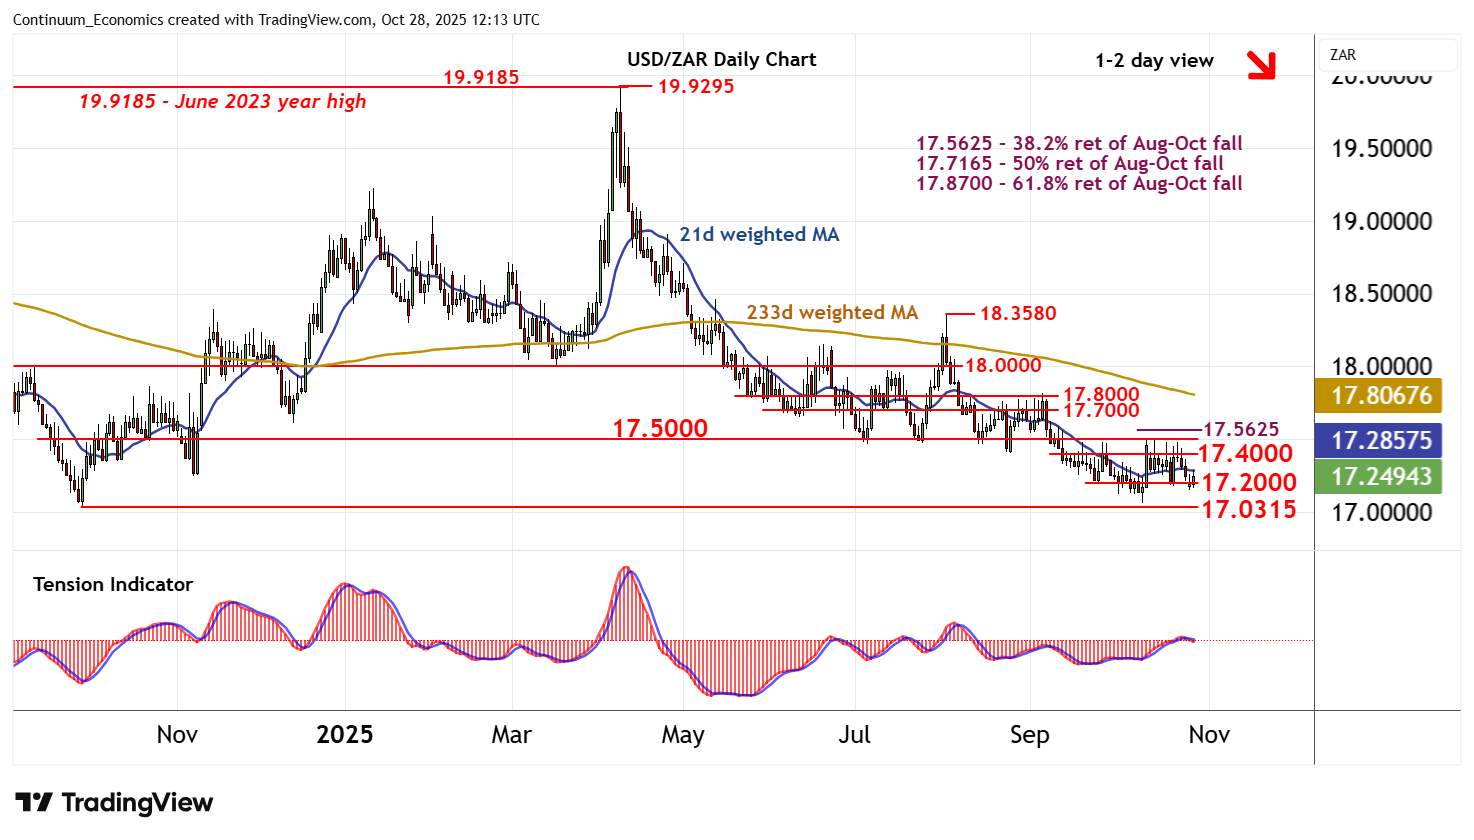
Chart USD/ZAR Update: Cautious trade - studies under pressure
The test below 17.2000 has bounced from 17.1500~, as intraday studies turn higher, with prices currently trading around 17.2500
| Level | Comment | Level | Comment | |||||
|---|---|---|---|---|---|---|---|---|
| R4 | 17.7000 | * | congestion | S1 | 17.2000 | * | congestion | |
| R3 | 17.5625 | * | 38.2% ret of Aug-Oct fall | S2 | 17.0630 | * | 9 Oct YTD low | |
| R2 | 17.5000 | ** | congestion | S3 | 17.0315 | ** | 30 Sep 2024 (y) low | |
| R1 | 17.4000 | congestion | S4 | 17.0000 | ** | congestion |
Asterisk denotes strength of level
12:00 GMT - The test below 17.2000 has bounced from 17.1500~, as intraday studies turn higher, with prices currently trading around 17.2500. Daily readings continue to track lower and broader weekly charts are under pressure, highlighting difficulty sustaining any further gains. Resistance is at congestion around 17.4000 and extends to 17.5000. This range should cap any immediate tests higher. Following cautious trade, fresh losses are looked for. A later break back below congestion support at 17.2000 will open up critical support at the 17.0315 year low of 30 September 2024 and the 17.0630 current year low of 9 October. A further close beneath here would turn sentiment negative and confirm a deeper corrective of the broad 2021-2023 rally.