Published: 2025-06-13T02:56:22.000Z
Chart USD/THB Update: Break to fresh year low

Technical Analyst
1
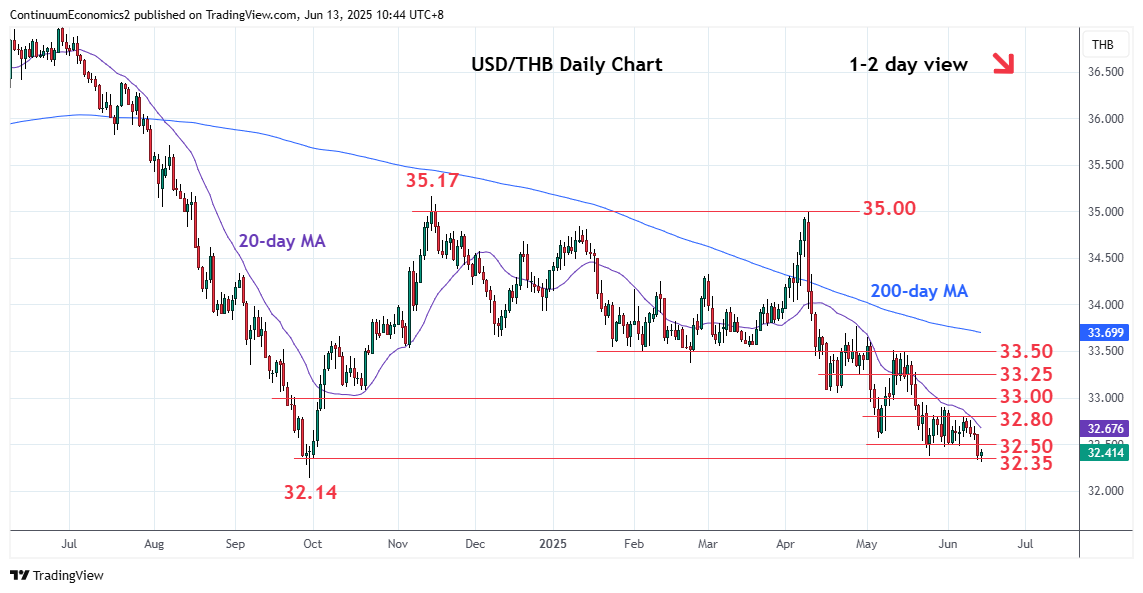
Break of support at the 32.50 congestion has seen follow-through to break May low at 32.37 to reach fresh year low at 32.31
| Level | Comment | Level | Comment | |||||
|---|---|---|---|---|---|---|---|---|
| R4 | 33.25 | * | congestion | S1 | 32.31 | * | intraday year low | |
| R3 | 33.00/05 | * | congestion, Apr low | S2 | 32.14 | ** | Sep 2024 year low | |
| R2 | 32.80/90 | ** | congestion, 29 May high | S3 | 32.08 | ** | Feb 2022 year low | |
| R1 | 32.50 | * | congestion | S4 | 32.00 | * | congestion |
Asterisk denotes strength of level
02:50 GMT - Break of support at the 32.50 congestion has seen follow-through to break May low at 32.37 to reach fresh year low at 32.31. Consolidation here see prices unwinding oversold intraday studies but this is expected to give way to renewed selling pressure later. Below this will further extend losses from the November high at 35.17 to retest 32.14, September 2024 year low. Below this, will turn focus to the 32.08, 2022 year low. Meanwhile, resistance is lowered to 32.50/32.56 area which is expected to cap and sustain bearish pressure from the 35.00, April YTD high.