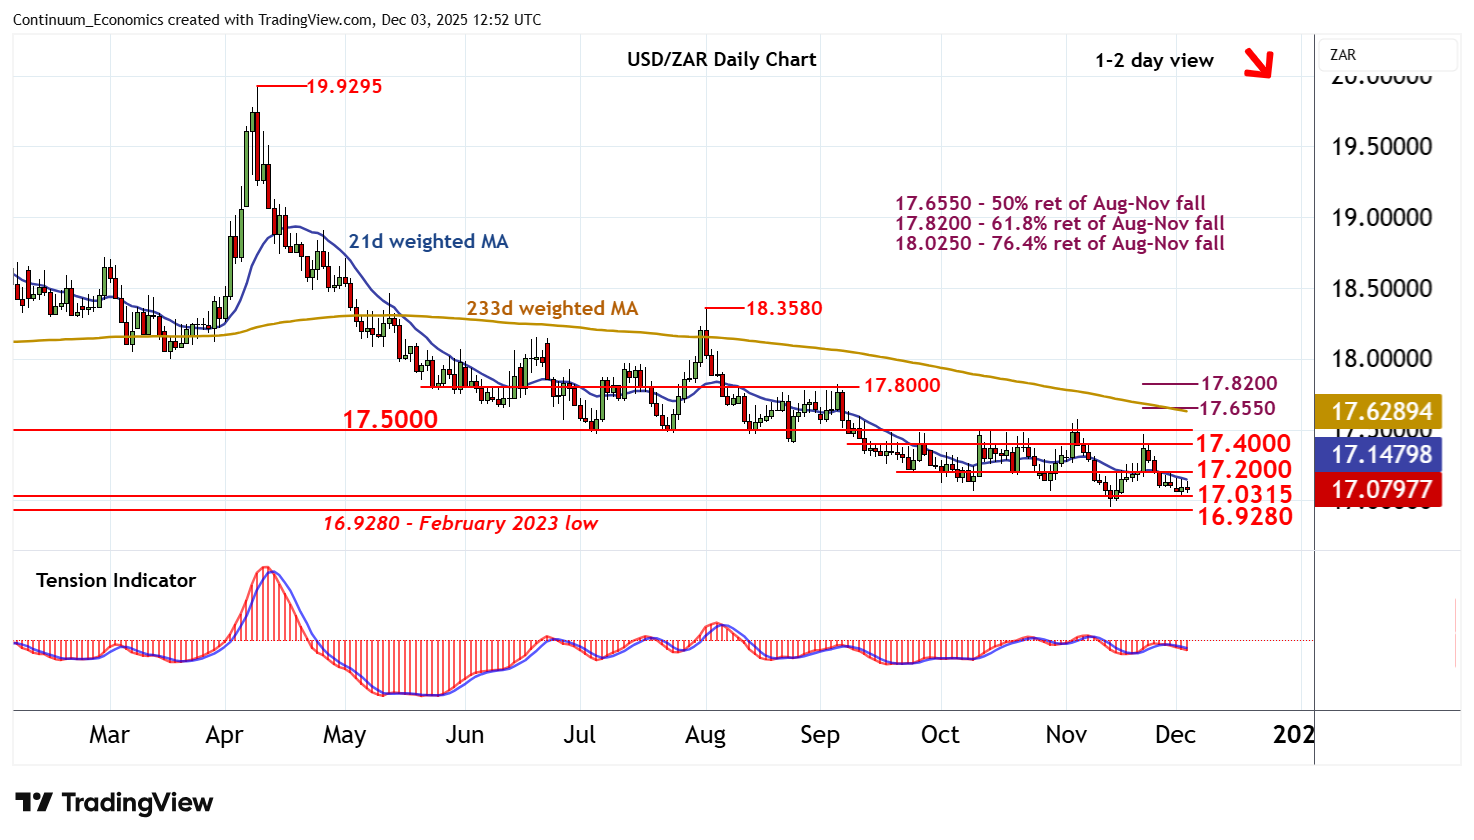
Chart USD/ZAR Update: Consolidating - long-term studies under pressure
The anticipated test of critical support within 16.9280 - 17.0315 is giving way to consolidation
| Level | Comment | Level | Comment | |||||
|---|---|---|---|---|---|---|---|---|
| R4 | 17.5775 | 5 Nov (w) high | S1 | 17.0315 | ** | 30 Sep 2024 (y) low | ||
| R3 | 17.5000 | ** | congestion | S2 | 17.0000 | ** | congestion | |
| R2 | 17.4000 | * | congestion | S3 | 16.9495 | ** | 13 Nov YTD low | |
| R1 | 17.2000 | * | congestion | S4 | 16.9280 | ** | February 2023 low |
Asterisk denotes strength of level
12:25 GMT - The anticipated test of critical support within 16.9280 - 17.0315 is giving way to consolidation, as intraday studies flatten, with prices currently balanced around 17.0830. Daily readings continue to track lower, highlighting room for a fresh test of here. But mixed/positive weekly charts are expected to limit any initial tests in consolidation, before bearish longer-term readings prompt further losses. A close below this range will turn sentiment negative and extend April losses towards the 16.6900~ year low of January 2023. Meanwhile, a close back above congestion resistance at 17.2000 would help to stabilise price action and prompt consolidation beneath congestion within 17.4000 - 17.5000.