Published: 2026-03-30T06:38:56.000Z
Chart AUD/JPY Update: Extending losses
1
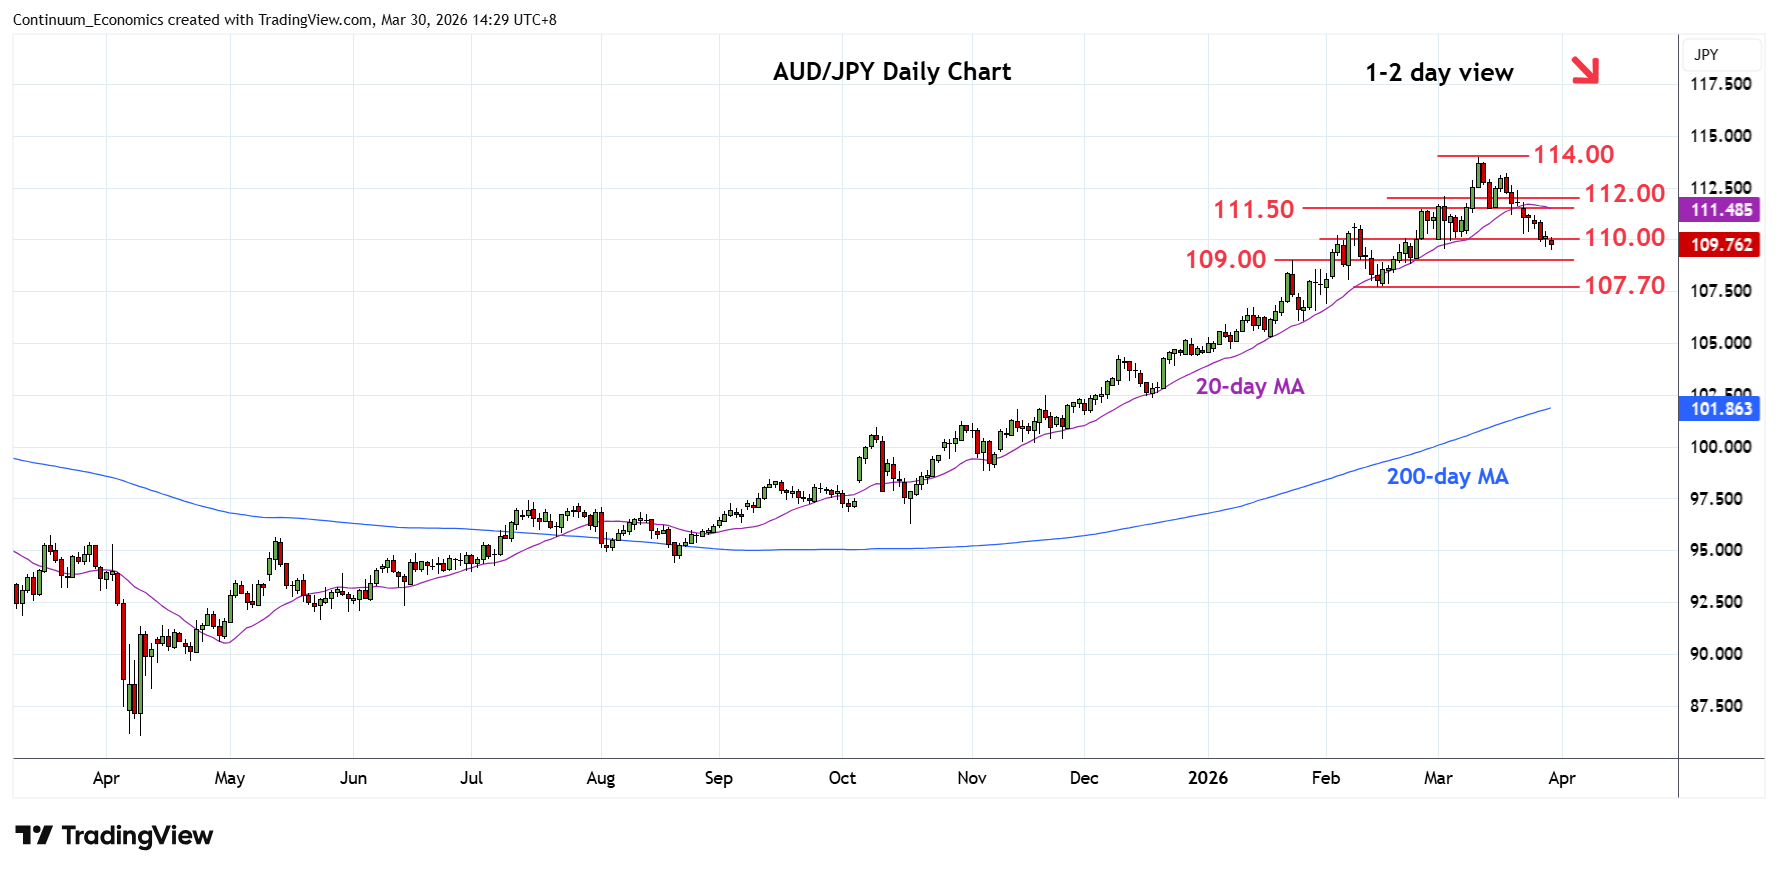
Pressure remains on the downside and break of the 110.00 level see prices extending losses from the 114.00, March current year high
| Levels | Imp | Comment | Levels | Imp | Comment | |||
|---|---|---|---|---|---|---|---|---|
| R4 | 113.20 | * | 18 Mar high | S1 | 109.00 | ** | Jan high | |
| R3 | 112.00 | ** | 3 Mar high, congestion | S2 | 107.70 | * | 13 Feb low | |
| R2 | 111.50 | * | 13 Mar low | S3 | 107.20 | * | 38.2% Oct/Mar rally | |
| R1 | 110.80 | * | 9 Feb high | S4 | 106.00 | * | congestion |
Asterisk denotes strength of level
06:35 GMT - Pressure remains on the downside and break of the 110.00 level see prices extending losses from the 114.00, March current year high. Negative daily studies suggest room for further losses to correct gains from the October low and lower will see room to support at the 109.00 level and the 108.00/107.70 area. Meanwhile, resistance is lowered to the 110.80 high of 9 February which is expected to cap. Only above here will see room for stronger bounce to resistance at the 111.50/112.00, 13 March low and congestion area.